Texas Instruments TI-34 II Teachers Guide - Page 97
Viewing the Data
 |
View all Texas Instruments TI-34 II manuals
Add to My Manuals
Save this manual to your list of manuals |
Page 97 highlights
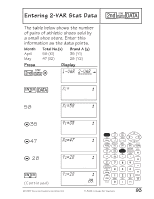
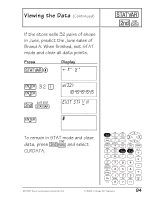
Viewing the Data (Continued) Find the number of data points (n), the mean (v), the sample standard deviation (Sx), the population standard deviation (sx), the sum of the scores (Gx), and the sum of the squares (Gx2). Press u Display n- ‡ Sx „x ¹ 5. STAT " n -‡ Sx „x ¹ 79.4 STAT " n ‡ Sx „x ¹ -- 16.39512123 STAT " n ‡ Sx „x ¹ -- 14.66424222 STAT " ¸-Š-" Šx2 397. STAT " ¸Š" -Š-x-2 32597. STAT u © 1999 TEXAS INSTRUMENTS INCORPORATED TI-34 Û: A Guide for Teachers 91
-
 1
1 -
2
-
3
-
4
-
5
-
6
-
7
-
8
-
9
-
10
-
11
-
12
-
13
-
14
-
15
-
16
-
17
-
18
-
19
-
20
-
21
-
22
-
23
-
24
-
25
-
26
-
27
-
28
-
29
-
30
-
31
-
32
-
33
-
34
-
35
-
36
-
37
-
38
-
39
-
40
-
41
-
42
-
43
-
44
-
45
-
46
-
47
-
48
-
49
-
50
-
51
-
52
-
53
-
54
-
55
-
56
-
57
-
58
-
59
-
60
-
61
-
62
-
63
-
64
-
65
-
66
-
67
-
68
-
69
-
70
-
71
-
72
-
73
-
74
-
75
-
76
-
77
-
78
-
79
-
80
-
81
-
82
-
83
-
84
-
85
-
86
-
87
-
88
-
89
-
90
-
91
-
 92
92 -
 93
93 -
 94
94 -
 95
95 -
 96
96 -
 97
97 -
 98
98 -
 99
99 -
 100
100 -
 101
101 -
 102
102 -
103
-
104
-
105
-
106
-
107
-
108
-
109
-
110
-
111
-
112
-
113
-
114
-
115
-
116
-
117
-
118
-
119
-
120
-
121
-
122
-
123
-
124
-
125
-
126
-
127
-
128
-
129
-
130
-
131
-
132
-
133
-
134
-
135
-
136
-
137
 |
 |

© 1999 T
EXAS
I
NSTRUMENTS
I
NCORPORATED
TI
-
34
Û
: A Guide for Teachers
91
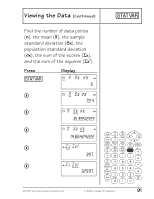
Viewing the Data
(Continued)
u
Find the number of data points
(
n
), the mean (
v
), the sample
standard deviation (
Sx
), the
population standard deviation
(
s
x
), the sum of the scores (
G
x
),
and the sum of the squares (
G
x
2
).
Press
Display
u
n
‡
Sx
„x
¹
-
5.
STAT
"
n
‡
Sx „x
¹
-
79.4
STAT
"
n ‡
Sx „x
¹
--
16.39512123
STAT
"
n ‡
Sx „x
¹
--
14.66424222
STAT
"
¸
Š” Šx
2
--
397.
STAT
"
¸
Š” Šx
2
---
32597.
STAT