ZyXEL WAC6303D-S User Guide - Page 71
Memory Usage, Memory Usage, LABEL, DESCRIPTION
 |
View all ZyXEL WAC6303D-S manuals
Add to My Manuals
Save this manual to your list of manuals |
Page 71 highlights
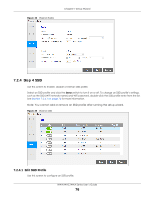
Chapter 6 Dashboard Figure 30 Dashboard > CPU Usage The following table describes the labels in this screen. Table 27 Dashboard > CPU Usage LABEL DESCRIPTION % The y-axis represents the percentage of CPU usage. time The x-axis shows the time period over which the CPU usage occurred. Refresh Interval Enter how often you want this window to be automatically updated. Refresh Now Click this to update the information in the window right away. 6.1.2 Memory Usage Use this screen to look at a chart of the Zyxel Device's recent memory (RAM) usage. To access this screen, click Memory Usage in the dashboard. Figure 31 Dashboard > Memory Usage NWA/WAC/WAX Series User's Guide 71
-
 1
1 -
2
-
3
-
4
-
5
-
6
-
7
-
8
-
9
-
10
-
11
-
12
-
13
-
14
-
15
-
16
-
17
-
18
-
19
-
20
-
21
-
22
-
23
-
24
-
25
-
26
-
27
-
28
-
29
-
30
-
31
-
32
-
33
-
34
-
35
-
36
-
37
-
38
-
39
-
40
-
41
-
42
-
43
-
44
-
45
-
46
-
47
-
48
-
49
-
50
-
51
-
52
-
53
-
54
-
55
-
56
-
57
-
58
-
59
-
60
-
61
-
62
-
63
-
64
-
65
-
 66
66 -
 67
67 -
 68
68 -
 69
69 -
 70
70 -
 71
71 -
 72
72 -
 73
73 -
 74
74 -
 75
75 -
 76
76 -
77
-
78
-
79
-
80
-
81
-
82
-
83
-
84
-
85
-
86
-
87
-
88
-
89
-
90
-
91
-
92
-
93
-
94
-
95
-
96
-
97
-
98
-
99
-
100
-
101
-
102
-
103
-
104
-
105
-
106
-
107
-
108
-
109
-
110
-
111
-
112
-
113
-
114
-
115
-
116
-
117
-
118
-
119
-
120
-
121
-
122
-
123
-
124
-
125
-
126
-
127
-
128
-
129
-
130
-
131
-
132
-
133
-
134
-
135
-
136
-
137
-
138
-
139
-
140
-
141
-
142
-
143
-
144
-
145
-
146
-
147
-
148
-
149
-
150
-
151
-
152
-
153
-
154
-
155
-
156
-
157
-
158
-
159
-
160
-
161
-
162
-
163
-
164
-
165
-
166
-
167
-
168
-
169
-
170
-
171
-
172
-
173
-
174
-
175
-
176
-
177
-
178
-
179
-
180
-
181
-
182
-
183
-
184
-
185
-
186
-
187
-
188
-
189
-
190
-
191
-
192
-
193
-
194
-
195
-
196
-
197
-
198
-
199
-
200
-
201
-
202
-
203
-
204
-
205
-
206
-
207
-
208
-
209
-
210
-
211
-
212
-
213
-
214
-
215
-
216
-
217
-
218
-
219
-
220
-
221
-
222
-
223
-
224
-
225
-
226
-
227
-
228
-
229
-
230
-
231
-
232
-
233
-
234
-
235
-
236
-
237
-
238
-
239
-
240
-
241
-
242
-
243
-
244
-
245
-
246
-
247
-
248
-
249
-
250
-
251
-
252
-
253
-
254
-
255
-
256
-
257
-
258
-
259
-
260
-
261
-
262
-
263
-
264
-
265
-
266
-
267
-
268
-
269
-
270
-
271
-
272
-
273
-
274
-
275
-
276
-
277
-
278
-
279
-
280
-
281
-
282
-
283
-
284
-
285
-
286
-
287
-
288
-
289
-
290
-
291
-
292
-
293
-
294
-
295
-
296
-
297
-
298
-
299
-
300
-
301
-
302
-
303
-
304
 |
 |

Chapter 6 Dashboard
NWA/WAC/WAX Series User’s Guide
71
Figure 30
Dashboard > CPU Usage
The following table describes the labels in this screen.
6.1.2
Memory Usage
Use this screen to look at a chart of the Zyxel Device’s recent memory (RAM) usage. To access this
screen, click
Memory Usage
in the dashboard.
Figure 31
Dashboard > Memory Usage
Table 27
Dashboard > CPU Usage
LABEL
DESCRIPTION
%
The y-axis represents the percentage of CPU usage.
time
The x-axis shows the time period over which the CPU usage occurred.
Refresh Interval
Enter how often you want this window to be automatically updated.
Refresh Now
Click this to update the information in the window right away.