ZyXEL WAC6303D-S User Guide - Page 91
View Log, All Logs, Debug Log, Monitor > Log, Search, View Log, LABEL, DESCRIPTION
 |
View all ZyXEL WAC6303D-S manuals
Add to My Manuals
Save this manual to your list of manuals |
Page 91 highlights
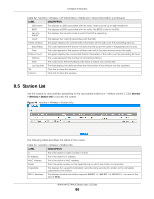
Chapter 8 Monitor Table 35 Monitor > Wireless > Detected Device (continued) LABEL DESCRIPTION Mark as Rogue AP Click this button to mark the selected AP as a rogue AP. For more on managing rogue APs, see the Configuration > Wireless > Rogue AP screen (Section 10.3 on page 109). Mark as Friendly AP Click this button to mark the selected AP as a friendly AP. For more on managing friendly APs, see the Configuration > Wireless > Rogue AP screen (Section 10.3 on page 109). # This is the detected device's index number in this list. Status This indicates the detected device's status. Device This indicates the type of device detected. Role This indicates the detected device's role (such as friendly or rogue). Classified by This indicates the detected device's classification rule. MAC Address This indicates the detected device's MAC address. SSID Name This indicates the detected device's SSID. Channel ID This indicates the detected device's channel ID. 802.11 Mode This indicates the 802.11 mode (a/b/g/n/ac/ax) transmitted by the detected device. Security This indicates the encryption method (if any) used by the detected device. Description This displays the detected device's description. For more on managing friendly and rogue APs, see the Configuration > Wireless > Rogue AP screen (Section 10.3 on page 109). Last Seen This indicates the last time the device was detected by the Zyxel Device. Refresh Click this to refresh the items displayed on this page. 8.8 View Log Log messages are stored in two separate logs, one for regular log messages and one for debugging messages. In the regular log, you can look at all the log messages by selecting All Logs, or you can select a specific category of log messages (for example, user). You can also look at the debugging log by selecting Debug Log. All debugging messages have the same priority. To access this screen, click Monitor > Log. The log is displayed in the following screen. Note: When a log reaches the maximum number of log messages, new log messages automatically overwrite existing log messages, starting with the oldest existing log message first. Events that generate an alert (as well as a log message) display in red. Regular logs display in black. Click a column's heading cell to sort the table entries by that column's criteria. Click the heading cell again to reverse the sort order. The Web Configurator saves the filter settings once you click Search. If you leave the View Log screen and return to it later, the last filter settings would still apply. NWA/WAC/WAX Series User's Guide 91
-
 1
1 -
2
-
3
-
4
-
5
-
6
-
7
-
8
-
9
-
10
-
11
-
12
-
13
-
14
-
15
-
16
-
17
-
18
-
19
-
20
-
21
-
22
-
23
-
24
-
25
-
26
-
27
-
28
-
29
-
30
-
31
-
32
-
33
-
34
-
35
-
36
-
37
-
38
-
39
-
40
-
41
-
42
-
43
-
44
-
45
-
46
-
47
-
48
-
49
-
50
-
51
-
52
-
53
-
54
-
55
-
56
-
57
-
58
-
59
-
60
-
61
-
62
-
63
-
64
-
65
-
66
-
67
-
68
-
69
-
70
-
71
-
72
-
73
-
74
-
75
-
76
-
77
-
78
-
79
-
80
-
81
-
82
-
83
-
84
-
85
-
 86
86 -
 87
87 -
 88
88 -
 89
89 -
 90
90 -
 91
91 -
 92
92 -
 93
93 -
 94
94 -
 95
95 -
 96
96 -
97
-
98
-
99
-
100
-
101
-
102
-
103
-
104
-
105
-
106
-
107
-
108
-
109
-
110
-
111
-
112
-
113
-
114
-
115
-
116
-
117
-
118
-
119
-
120
-
121
-
122
-
123
-
124
-
125
-
126
-
127
-
128
-
129
-
130
-
131
-
132
-
133
-
134
-
135
-
136
-
137
-
138
-
139
-
140
-
141
-
142
-
143
-
144
-
145
-
146
-
147
-
148
-
149
-
150
-
151
-
152
-
153
-
154
-
155
-
156
-
157
-
158
-
159
-
160
-
161
-
162
-
163
-
164
-
165
-
166
-
167
-
168
-
169
-
170
-
171
-
172
-
173
-
174
-
175
-
176
-
177
-
178
-
179
-
180
-
181
-
182
-
183
-
184
-
185
-
186
-
187
-
188
-
189
-
190
-
191
-
192
-
193
-
194
-
195
-
196
-
197
-
198
-
199
-
200
-
201
-
202
-
203
-
204
-
205
-
206
-
207
-
208
-
209
-
210
-
211
-
212
-
213
-
214
-
215
-
216
-
217
-
218
-
219
-
220
-
221
-
222
-
223
-
224
-
225
-
226
-
227
-
228
-
229
-
230
-
231
-
232
-
233
-
234
-
235
-
236
-
237
-
238
-
239
-
240
-
241
-
242
-
243
-
244
-
245
-
246
-
247
-
248
-
249
-
250
-
251
-
252
-
253
-
254
-
255
-
256
-
257
-
258
-
259
-
260
-
261
-
262
-
263
-
264
-
265
-
266
-
267
-
268
-
269
-
270
-
271
-
272
-
273
-
274
-
275
-
276
-
277
-
278
-
279
-
280
-
281
-
282
-
283
-
284
-
285
-
286
-
287
-
288
-
289
-
290
-
291
-
292
-
293
-
294
-
295
-
296
-
297
-
298
-
299
-
300
-
301
-
302
-
303
-
304
 |
 |
