D-Link 1226G User Manual - Page 9
MAC Address, IP Address, Protocol version, Product Name, System Name, Location, Trap IP, Subnet Mask
 |
UPC - 790069264221
View all D-Link 1226G manuals
Add to My Manuals
Save this manual to your list of manuals |
Page 9 highlights
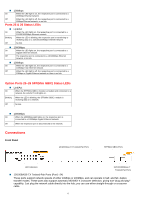
Figure 1. Web Management Utility The Web Management Utility is divided into four parts, Discovery List, Monitor List, Device Setting, and Toolbar function. For detailed instruction, follow the section below. Discovery List This is the list where you can discover all the D-Link Web-Smart devices in the entire network By clicking on the "Discovery" button, you can list all the Web-Smart devices in the discovery list. Double click or press the "Add to monitor list" button to select a device from the Discovery List to the Monitor List. System word definitions in the Discovery List: MAC Address: Shows the device MAC Address. IP Address: Shows the current IP address of the device. Protocol version: Shows the version of the Utility protocol. Product Name: Shows the device product name. System Name: Shows the appointed device system name. Location: Shows where the device is located. Trap IP: Shows the IP where the Trap is to be sent. Subnet Mask: Shows the Subnet Mask set of the device. Gateway: Shows the Gateway set of the device. Monitor List All the Web Smart Devices in the Monitor List can be monitored; you can also receive a trap and show the status of the device. System word definitions in the Monitor List: S: Shows the system symbol of the Web-Smart device, represents that the device system is not alive. IP Address: Shows the current IP address of the device. MAC Address: Shows the device MAC Address. Protocol version: Shows the version of the Utility protocol. Product Name: Shows the device product name. System Name: Shows the appointed device system name. Location: Shows where the device is located. Trap IP: Shows the IP where the Trap is to be sent. Subnet Mask: Shows the Subnet Mask set of the device. Gateway: Shows the Gateway set of the device. View Trap: The Trap function can receive the events that occur from the Web-Smart Switch in the Monitor List. There is a light indicator behind the "View Trap" button. When the light is green, it indicates that no trap has been transmitted, and when it is red, it indicates that a new trap has been transmitted, reminding us to view the trap. (Figure 2) Figure 2. When the "View Trap" button is clicked, a Trap Information window will pop up, displaying trap information including the Symbol, Time, Device IP, and the Event occured. (Figure 3) The symbol " " represents the trap signal; this symbol will disappear after you review and click on the event record. 9
-
 1
1 -
2
-
3
-
 4
4 -
 5
5 -
 6
6 -
 7
7 -
 8
8 -
 9
9 -
 10
10 -
 11
11 -
 12
12 -
 13
13 -
 14
14 -
15
-
16
-
17
-
18
-
19
-
20
-
21
-
22
-
23
-
24
-
25
-
26
-
27
-
28
-
29
 |
 |
