D-Link DES-3326SRM Product Manual - Page 119
Port Utilization Statistics, Port Utilization Line Chart, Parameter, Description
 |
UPC - 790069255304
View all D-Link DES-3326SRM manuals
Add to My Manuals
Save this manual to your list of manuals |
Page 119 highlights
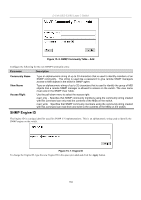
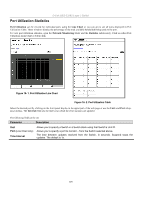
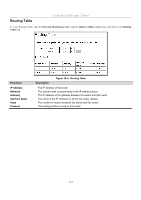
D-Link DES-3326S Layer 3 Switch Port Utilization Statistics Port Utilization can be viewed for individual ports using the Line Chart or you can opt to see all ports displayed in Port Utilization Table. These windows display the percentage of the total available bandwidth being used on the port. To view port utilization statistics, open the Network Monitoring folder and the Statistics subdirectory. Click on either Port Utilization (Line Chart or Table) link: Figure 16- 1. Port Utilization Line Chart Figure 16- 2. Port Utilization Table Select the desired port by clicking on the front panel display in the upper part of the web page or use the Unit: and Port: dropdown menus. The Interval field sets the interval at which the error statistics are updated. The following field can be set: Parameter Description Unit Port (Line Chart only) Time Interval Allows you to specify a Switch in a Switch stack using that Switch's Unit ID. Allows you to specify a port to monitor − from the Switch selected above. The time between updates received from the Switch, in seconds. Suspend stops the updates. The default is 1s. 109
-
 1
1 -
2
-
3
-
4
-
5
-
6
-
7
-
8
-
9
-
10
-
11
-
12
-
13
-
14
-
15
-
16
-
17
-
18
-
19
-
20
-
21
-
22
-
23
-
24
-
25
-
26
-
27
-
28
-
29
-
30
-
31
-
32
-
33
-
34
-
35
-
36
-
37
-
38
-
39
-
40
-
41
-
42
-
43
-
44
-
45
-
46
-
47
-
48
-
49
-
50
-
51
-
52
-
53
-
54
-
55
-
56
-
57
-
58
-
59
-
60
-
61
-
62
-
63
-
64
-
65
-
66
-
67
-
68
-
69
-
70
-
71
-
72
-
73
-
74
-
75
-
76
-
77
-
78
-
79
-
80
-
81
-
82
-
83
-
84
-
85
-
86
-
87
-
88
-
89
-
90
-
91
-
92
-
93
-
94
-
95
-
96
-
97
-
98
-
99
-
100
-
101
-
102
-
103
-
104
-
105
-
106
-
107
-
108
-
109
-
110
-
111
-
112
-
113
-
 114
114 -
 115
115 -
 116
116 -
 117
117 -
 118
118 -
 119
119 -
 120
120 -
 121
121 -
 122
122 -
 123
123 -
 124
124 -
125
-
126
-
127
-
128
-
129
-
130
-
131
-
132
-
133
-
134
-
135
-
136
-
137
-
138
-
139
-
140
-
141
-
142
-
143
-
144
-
145
-
146
-
147
-
148
-
149
-
150
-
151
-
152
-
153
-
154
-
155
-
156
-
157
-
158
-
159
-
160
-
161
-
162
-
163
-
164
-
165
-
166
-
167
-
168
-
169
-
170
-
171
-
172
-
173
-
174
-
175
-
176
-
177
-
178
-
179
-
180
-
181
-
182
-
183
-
184
-
185
-
186
-
187
-
188
-
189
-
190
-
191
-
192
-
193
-
194
-
195
-
196
-
197
-
198
-
199
-
200
-
201
-
202
-
203
-
204
-
205
-
206
-
207
-
208
-
209
-
210
-
211
-
212
-
213
-
214
-
215
-
216
-
217
-
218
-
219
-
220
-
221
-
222
-
223
-
224
-
225
-
226
-
227
-
228
-
229
-
230
-
231
-
232
-
233
-
234
-
235
-
236
-
237
-
238
-
239
-
240
-
241
-
242
 |
 |
