Dell Brocade 300 Web Tools Administrator's Guide v7.1.0 - Page 123
Customizing basic monitoring graphs
 |
View all Dell Brocade 300 manuals
Add to My Manuals
Save this manual to your list of manuals |
Page 123 highlights
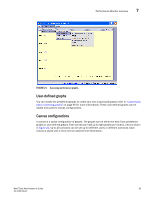
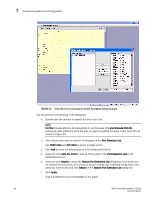
Customizing basic monitoring graphs 7 NOTE For the Brocade 300, 5100, 5300, 6510, 6520, VA-40FC, 7800 Extension, 8000, and the Encryption Switch, enter only a port number. 4. Click OK. The graph is displayed in a window in the Performance Monitor window. Customizing basic monitoring graphs You can customize some of the basic performance monitoring graphs to display information for particular ports. For the Brocade 8510-8, Brocade 8510-4, and Brocade DCX and DCX-4S enterprise-class platforms, you can also customize these graphs to display information for a slot. You can customize the following graphs: • Switch Throughput Utilization • Switch Percent Utilization • Port Snapshot Error The following procedure assumes that you already created one of these customizable graphs. 1. Create or access the graph you want to customize. Refer to "Creating basic performance monitor graphs" on page 94 for instructions on creating a graph. 2. For Brocade 8510-8, Brocade 8510-4, and Brocade DCX and DCX-4S enterprise-class platforms, display the detailed port throughput utilization rates for each port in a slot by clicking the arrows next to a slot. The port information for that slot displays in the graph. NOTE For the Brocade 300, 5100, 5300, 6510, 6520, VA-40FC, 7800 Extension, 8000, and the Encryption Switch, proceed to step 3. 3. To display detailed port throughput utilization rates for particular ports only, right-click anywhere in the graph and click Select Ports. The setup dialog box displays, as shown in Figure 23. The title of the dialog box varies, depending on the type of graph you are customizing, but the layout of the dialog box is the same. Figure 23 displays an example of the setup dialog box for the Edit Switch Throughput Utilization graph. Web Tools Administrator's Guide 95 53-1002756-01
-
 1
1 -
2
-
3
-
4
-
5
-
6
-
7
-
8
-
9
-
10
-
11
-
12
-
13
-
14
-
15
-
16
-
17
-
18
-
19
-
20
-
21
-
22
-
23
-
24
-
25
-
26
-
27
-
28
-
29
-
30
-
31
-
32
-
33
-
34
-
35
-
36
-
37
-
38
-
39
-
40
-
41
-
42
-
43
-
44
-
45
-
46
-
47
-
48
-
49
-
50
-
51
-
52
-
53
-
54
-
55
-
56
-
57
-
58
-
59
-
60
-
61
-
62
-
63
-
64
-
65
-
66
-
67
-
68
-
69
-
70
-
71
-
72
-
73
-
74
-
75
-
76
-
77
-
78
-
79
-
80
-
81
-
82
-
83
-
84
-
85
-
86
-
87
-
88
-
89
-
90
-
91
-
92
-
93
-
94
-
95
-
96
-
97
-
98
-
99
-
100
-
101
-
102
-
103
-
104
-
105
-
106
-
107
-
108
-
109
-
110
-
111
-
112
-
113
-
114
-
115
-
116
-
117
-
 118
118 -
 119
119 -
 120
120 -
 121
121 -
 122
122 -
 123
123 -
 124
124 -
 125
125 -
 126
126 -
 127
127 -
 128
128 -
129
-
130
-
131
-
132
-
133
-
134
-
135
-
136
-
137
-
138
-
139
-
140
-
141
-
142
-
143
-
144
-
145
-
146
-
147
-
148
-
149
-
150
-
151
-
152
-
153
-
154
-
155
-
156
-
157
-
158
-
159
-
160
-
161
-
162
-
163
-
164
-
165
-
166
-
167
-
168
-
169
-
170
-
171
-
172
-
173
-
174
-
175
-
176
-
177
-
178
-
179
-
180
-
181
-
182
-
183
-
184
-
185
-
186
-
187
-
188
-
189
-
190
-
191
-
192
-
193
-
194
-
195
-
196
-
197
-
198
-
199
-
200
-
201
-
202
-
203
-
204
-
205
-
206
-
207
-
208
-
209
-
210
-
211
-
212
-
213
-
214
-
215
-
216
-
217
-
218
-
219
-
220
-
221
-
222
-
223
-
224
-
225
-
226
-
227
-
228
-
229
-
230
-
231
-
232
-
233
-
234
-
235
-
236
-
237
-
238
-
239
-
240
-
241
-
242
-
243
-
244
-
245
-
246
-
247
-
248
-
249
-
250
-
251
-
252
-
253
-
254
-
255
-
256
-
257
-
258
-
259
-
260
-
261
-
262
-
263
-
264
-
265
-
266
-
267
-
268
 |
 |
