Dell PowerEdge XL 5133-4 Dell PowerEdge FTOS Command Line Reference Guide for - Page 253
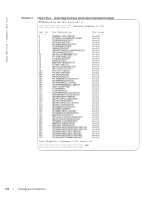
show diag testcase stack-unit interactive Command Example, Example 4, Syntax, Parameters
 |
View all Dell PowerEdge XL 5133-4 manuals
Add to My Manuals
Save this manual to your list of manuals |
Page 253 highlights
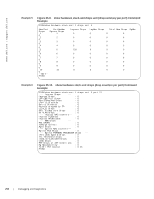
Example 4 Figure 25-4. show diag testcase stack-unit interactive Command Example FTOS#show diag testcase stack-unit 0 interactive Navasota Diagnostics Test Test ID ------401 402 403 404 405 406 407 408 409 410 411 Test Description POWERLEDTEST DEBUGLEDTEST STATUSLEDTEST OPTMODLEDCONTROLTEST FIXEDLEDCONTROLTEST RTCBATTERYTEST CPLDRESETTEST I2CDEVICESCANTEST SERVERPORTPHYEXTLINKTEST CPUSNAKEQSFPPEXTLPBKTEST CPUSNAKEOPTMODEXTLPBKTEST Test Level ---------Interactive Interactive Interactive Interactive Interactive Interactive Interactive Interactive Interactive Interactive Interactive Total Diagnostic Testcases in Interactive: 11 END show hardware stack-unit Displays the data plane or management plane input and output statistics of the designated component of the designated stack member. Syntax show hardware stack-unit 0-5 {buffer [buffer unit | port [(1-56) | all] total buffer | buffer unit (1) port (1-56) queue [(0-14) | a11] buffer-info} {phy-firmware-version} {cpu data-plane statistics [stack-port 0-52] | cpu party-bus statistics | cpu private-mgmt statistics | drops [unit 0-1 [port 1-56]] | stack-port 33-56 | unit 0-0 {counters | details | port-stats [detail] | register}} Parameters stack-unit 0-5 {command-option} buffer fpga fru phy-firmware-version Enter the keyword stack-unit followed by 0 to 5 to select a particular stack member and then enter one of the following command options to display a collection of data based on the option entered. Enter the keyword buffer, optionally followed by the keywords total-buffer to show the total buffer statistics per stack unit. Enter the keywords buffer unit then total-buffer to display the buffer details per unit and mode of allocation. To display the forwarding plane statistics containing the packet buffer usage per port per stack unit, enter the keywords buffer unit followed by port and the port number (1-56 or all), then buffer-info. To display the forwarding plane statistics containing the packet buffer statistics per COS per port, enter the keywords buffer unit and port (1-56), and queue (0-14 or all), and buffer-info. Buffer unit default: 1 Enter the keyword fpga, to display fpga details. Enter the keyword fru, to display fru details. Each member of the stack is updated automatically with the latest firmware while booting as well as during OIR. Enter the keyword phy-firmware-version, to dump the physical firmware version for stack units. Debugging and Diagnostics | 251
-
 1
1 -
2
-
3
-
4
-
5
-
6
-
7
-
8
-
9
-
10
-
11
-
12
-
13
-
14
-
15
-
16
-
17
-
18
-
19
-
20
-
21
-
22
-
23
-
24
-
25
-
26
-
27
-
28
-
29
-
30
-
31
-
32
-
33
-
34
-
35
-
36
-
37
-
38
-
39
-
40
-
41
-
42
-
43
-
44
-
45
-
46
-
47
-
48
-
49
-
50
-
51
-
52
-
53
-
54
-
55
-
56
-
57
-
58
-
59
-
60
-
61
-
62
-
63
-
64
-
65
-
66
-
67
-
68
-
69
-
70
-
71
-
72
-
73
-
74
-
75
-
76
-
77
-
78
-
79
-
80
-
81
-
82
-
83
-
84
-
85
-
86
-
87
-
88
-
89
-
90
-
91
-
92
-
93
-
94
-
95
-
96
-
97
-
98
-
99
-
100
-
101
-
102
-
103
-
104
-
105
-
106
-
107
-
108
-
109
-
110
-
111
-
112
-
113
-
114
-
115
-
116
-
117
-
118
-
119
-
120
-
121
-
122
-
123
-
124
-
125
-
126
-
127
-
128
-
129
-
130
-
131
-
132
-
133
-
134
-
135
-
136
-
137
-
138
-
139
-
140
-
141
-
142
-
143
-
144
-
145
-
146
-
147
-
148
-
149
-
150
-
151
-
152
-
153
-
154
-
155
-
156
-
157
-
158
-
159
-
160
-
161
-
162
-
163
-
164
-
165
-
166
-
167
-
168
-
169
-
170
-
171
-
172
-
173
-
174
-
175
-
176
-
177
-
178
-
179
-
180
-
181
-
182
-
183
-
184
-
185
-
186
-
187
-
188
-
189
-
190
-
191
-
192
-
193
-
194
-
195
-
196
-
197
-
198
-
199
-
200
-
201
-
202
-
203
-
204
-
205
-
206
-
207
-
208
-
209
-
210
-
211
-
212
-
213
-
214
-
215
-
216
-
217
-
218
-
219
-
220
-
221
-
222
-
223
-
224
-
225
-
226
-
227
-
228
-
229
-
230
-
231
-
232
-
233
-
234
-
235
-
236
-
237
-
238
-
239
-
240
-
241
-
242
-
243
-
244
-
245
-
246
-
247
-
 248
248 -
 249
249 -
 250
250 -
 251
251 -
 252
252 -
 253
253 -
 254
254 -
 255
255 -
 256
256 -
 257
257 -
 258
258 -
259
-
260
-
261
-
262
-
263
-
264
 |
 |
