Dell PowerEdge XL 5133-4 Dell PowerEdge FTOS Command Line Reference Guide for - Page 255
Command Example, show hardware stack-unit cpu party-bus statistics Command Example
 |
View all Dell PowerEdge XL 5133-4 manuals
Add to My Manuals
Save this manual to your list of manuals |
Page 255 highlights
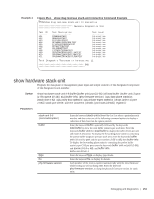
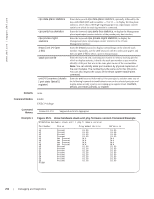
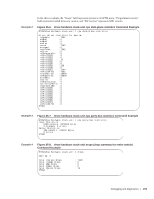
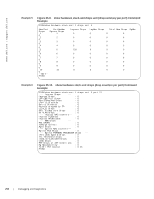
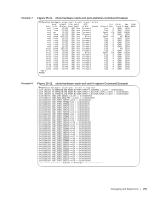
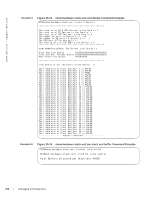
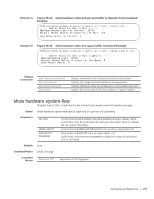
Example 2 In the above example, the "Status" field represents presence of OPTM ports, "Programmed version" field represents loaded firmware version, and "SW version" represents SDK version. Figure 25-6. show hardware stack-unit cpu data-plane statistics Command Example FTOS#show hardware stack-unit 1 cpu data-plane statistics bc pci driver statistics for device: rxHandle :7392 noMhdr :0 noMbuf :0 noClus :0 recvd :7392 dropped :0 recvToNet :7392 rxError :0 rxDatapathErr :0 rxPkt(COS0) :0 rxPkt(COS1) :0 rxPkt(COS2) :10 rxPkt(COS3) :0 rxPkt(COS4) :0 rxPkt(COS5) :338 rxPkt(COS6) :0 rxPkt(COS7) :7044 rxPkt(UNIT0) :7392 transmitted :29899 txRequested :29899 noTxDesc :0 txError :0 txReqTooLarge :0 txInternalError :0 txDatapathErr :0 txPkt(COS0) :0 txPkt(COS1) :0 txPkt(COS2) :0 txPkt(COS3) :0 txPkt(COS4) :0 txPkt(COS5) :0 txPkt(COS6) :0 txPkt(COS7) :0 txPkt(UNIT0) :0 FTOS# Example 3 Figure 25-7. show hardware stack-unit cpu party-bus statistics Command Example FTOS#show hardware stack-unit 1 cpu party-bus statistics Input Statistics: 8189 packets, 8076608 bytes 0 dropped, 0 errors Output Statistics: 366 packets, 133100 bytes 0 errors FTOS# Example 4 Figure 25-8. show hardware stack-unit drops (drop summary for entire switch) Command Example FTOS#show hardware stack-unit 1 drops UNIT No: 0 Total Ingress Drops Total IngMac Drops Total Mmu Drops Total EgMac Drops Total Egress Drops FTOS# : 7448 : 0 : 0 : 0 : 16 Debugging and Diagnostics | 253
-
 1
1 -
2
-
3
-
4
-
5
-
6
-
7
-
8
-
9
-
10
-
11
-
12
-
13
-
14
-
15
-
16
-
17
-
18
-
19
-
20
-
21
-
22
-
23
-
24
-
25
-
26
-
27
-
28
-
29
-
30
-
31
-
32
-
33
-
34
-
35
-
36
-
37
-
38
-
39
-
40
-
41
-
42
-
43
-
44
-
45
-
46
-
47
-
48
-
49
-
50
-
51
-
52
-
53
-
54
-
55
-
56
-
57
-
58
-
59
-
60
-
61
-
62
-
63
-
64
-
65
-
66
-
67
-
68
-
69
-
70
-
71
-
72
-
73
-
74
-
75
-
76
-
77
-
78
-
79
-
80
-
81
-
82
-
83
-
84
-
85
-
86
-
87
-
88
-
89
-
90
-
91
-
92
-
93
-
94
-
95
-
96
-
97
-
98
-
99
-
100
-
101
-
102
-
103
-
104
-
105
-
106
-
107
-
108
-
109
-
110
-
111
-
112
-
113
-
114
-
115
-
116
-
117
-
118
-
119
-
120
-
121
-
122
-
123
-
124
-
125
-
126
-
127
-
128
-
129
-
130
-
131
-
132
-
133
-
134
-
135
-
136
-
137
-
138
-
139
-
140
-
141
-
142
-
143
-
144
-
145
-
146
-
147
-
148
-
149
-
150
-
151
-
152
-
153
-
154
-
155
-
156
-
157
-
158
-
159
-
160
-
161
-
162
-
163
-
164
-
165
-
166
-
167
-
168
-
169
-
170
-
171
-
172
-
173
-
174
-
175
-
176
-
177
-
178
-
179
-
180
-
181
-
182
-
183
-
184
-
185
-
186
-
187
-
188
-
189
-
190
-
191
-
192
-
193
-
194
-
195
-
196
-
197
-
198
-
199
-
200
-
201
-
202
-
203
-
204
-
205
-
206
-
207
-
208
-
209
-
210
-
211
-
212
-
213
-
214
-
215
-
216
-
217
-
218
-
219
-
220
-
221
-
222
-
223
-
224
-
225
-
226
-
227
-
228
-
229
-
230
-
231
-
232
-
233
-
234
-
235
-
236
-
237
-
238
-
239
-
240
-
241
-
242
-
243
-
244
-
245
-
246
-
247
-
248
-
249
-
 250
250 -
 251
251 -
 252
252 -
 253
253 -
 254
254 -
 255
255 -
 256
256 -
 257
257 -
 258
258 -
 259
259 -
 260
260 -
261
-
262
-
263
-
264
 |
 |
