Garmin Edge 520 Owners Manual - Page 14
Using Shimano, Shifters, Using the Weight Scale, Viewing Your Ride
 |
View all Garmin Edge 520 manuals
Add to My Manuals
Save this manual to your list of manuals |
Page 14 highlights
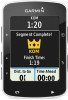
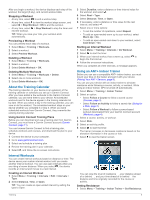
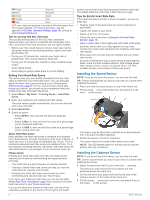
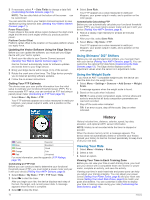
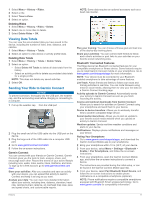
3 If necessary, select > Data Fields to change a data field (Customizing the Data Screens, page 13). NOTE: The two data fields at the bottom of the screen can à be customized. You can send the ride to your Garmin Connect account to view additional cycling dynamics data (Sending Your Ride to Garmin Connect, page 11). Power Phase Data Power phase is the pedal stroke region (between the start crank angle and the end crank angle) where you produce positive power. Platform Center Offset Platform center offset is the location on the pedal platform where you apply force. Updating the Vector Software Using the Edge Device Before you can update the software, you must pair your Edge device with your Vector system. 1 Send your ride data to your Garmin Connect account (Sending Your Ride to Garmin Connect, page 11). Garmin Connect automatically looks for software updates and sends them to your Edge device. 2 Bring your Edge device within range (3 m) of the sensor. 3 Rotate the crank arm a few times. The Edge device prompts you to install all pending software updates. 4 Follow the on-screen instructions. Getting Your FTP Estimate The device uses your user profile information from the initial setup to estimate your functional threshold power (FTP). For a more accurate FTP value, you can conduct an FTP test using a paired power meter (Conducting an FTP Test, page 10). Select Menu > My Stats > FTP. Your FTP estimate appears as a value measured in watts per kilogram, your power output in watts, and a position on the color gauge. 4 Select Save Ride. Your FTP appears as a value measured in watts per kilogram, your power output in watts, and a position on the color gauge. Automatically Calculating FTP Before you can automatically calculate your functional threshold power (FTP), you must install a power meter and pair it with your device (Pairing Your ANT+ Sensors, page 9). 1 Ride at a steady, high intensity for at least 20 minutes outdoors. 2 After your ride, select Save Ride. 3 Select Menu > My Stats > FTP. Your FTP appears as a value measured in watts per kilogram, your power output in watts, and a position on the color gauge. Using Shimano® Di2™ Shifters Before you can use Di2 electronic shifters, you must pair them with your device (Pairing Your ANT+ Sensors, page 9). You can customize the optional Di2 data fields (Customizing the Data Screens, page 13). The Edge device displays current adjustment values when the sensor is in adjustment mode. Using the Weight Scale If you have an ANT+ compatible weight scale, the device can read the data from the weight scale. 1 Select Menu > Settings > Sensors > Add Sensor > Weight Scale. A message appears when the weight scale is found. 2 Stand on the scale when indicated. NOTE: If using a body composition scale, remove shoes and socks to ensure that all body composition parameters are read and recorded. 3 Step off the scale when indicated. TIP: If an error occurs, step off the scale. Step on when indicated. Purple Superior Blue Excellent Green Good Orange Fair Red Untrained For more information, see the appendix (FTP Ratings, page 18). Conducting an FTP Test Before you can conduct a test to determine your functional threshold power (FTP), you must install a power meter and pair it with your device (Pairing Your ANT+ Sensors, page 9). 1 Select Menu > My Stats > FTP > FTP Test > Ride. 2 Select to start the timer. After you begin your ride, the device displays each step of the test, the target, and current power data. A message appears when the test is complete. 3 Select to stop the timer. 10 History History includes time, distance, calories, speed, lap data, elevation, and optional ANT+ sensor information. NOTE: History is not recorded while the timer is stopped or paused. When the device memory is full, a message appears. The device does not automatically delete or overwrite your history. Upload your history to Garmin Connect periodically to keep track of all your ride data. Viewing Your Ride 1 Select Menu > History > Rides. 2 Select a ride. 3 Select an option. Viewing Your Time in Each Training Zone Before you can view your time in each training zone, you must pair your device with a compatible heart rate monitor or power meter, complete an activity, and save the activity. Viewing your time in each heart rate and power zone can help you adjust your training intensity. You can adjust your power zones (Setting Your Power Zones, page 9) and your heart rate zones (Setting Your Heart Rate Zones, page 8) to match your goals and abilities. You can customize a data field to display your time in training zones during your ride (Customizing the Data Screens, page 13). History
-
 1
1 -
2
-
3
-
4
-
5
-
6
-
7
-
8
-
 9
9 -
 10
10 -
 11
11 -
 12
12 -
 13
13 -
 14
14 -
 15
15 -
 16
16 -
 17
17 -
 18
18 -
 19
19 -
20
-
21
-
22
-
23
-
24
-
25
-
26
 |
 |