Garmin Edge 520 Owners Manual - Page 23

Heart Rate Zone Calculations, VO2 Max. Standard Ratings, Wheel Size and Circumference

Page 23 highlights

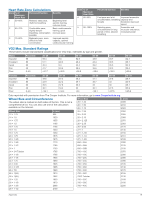
Heart Rate Zone Calculations Zone % of Maximum Heart Rate Perceived Exertion 1 50-60% Relaxed, easy pace, rhythmic breathing 2 60-70% 3 70-80% Comfortable pace, slightly deeper breathing, conversation possible Moderate pace, more difficult to hold conversation Benefits Beginning-level aerobic training, reduces stress Basic cardiovascular training, good recovery pace Improved aerobic capacity, optimal cardiovascular training Zone % of Maximum Heart Rate 4 80-90% 5 90-100% Perceived Exertion Benefits Fast pace and a bit Improved anaerobic uncomfortable, breathing capacity and forceful threshold, improved speed Sprinting pace, unsustainable for long period of time, labored breathing Anaerobic and muscular endurance, increased power VO2 Max. Standard Ratings These tables include standardized classifications for VO2 max. estimates by age and gender. Males Superior Excellent Good Fair Poor Percentile 95 80 60 40 0-40 20-29 55.4 51.1 45.4 41.7

  • 1
  • 2
  • 3
  • 4
  • 5
  • 6
  • 7
  • 8
  • 9
  • 10
  • 11
  • 12
  • 13
  • 14
  • 15
  • 16
  • 17
  • 18
  • 19
  • 20
  • 21
  • 22
  • 23
  • 24
  • 25
  • 26

Heart Rate Zone Calculations
Zone
% of
Maximum
Heart Rate
Perceived Exertion
Benefits
1
50–60%
Relaxed, easy pace,
rhythmic breathing
Beginning-level
aerobic training,
reduces stress
2
60–70%
Comfortable pace,
slightly deeper
breathing, conversation
possible
Basic cardiovascular
training, good
recovery pace
3
70–80%
Moderate pace, more
difficult to hold
conversation
Improved aerobic
capacity, optimal
cardiovascular training
Zone
% of
Maximum
Heart Rate
Perceived Exertion
Benefits
4
80–90%
Fast pace and a bit
uncomfortable, breathing
forceful
Improved anaerobic
capacity and
threshold, improved
speed
5
90–100%
Sprinting pace,
unsustainable for long
period of time, labored
breathing
Anaerobic and
muscular endurance,
increased power
VO2 Max. Standard Ratings
These tables include standardized classifications for VO2 max. estimates by age and gender.
Males
Percentile
20–29
30–39
40–49
50–59
60–69
70–79
Superior
95
55.4
54
52.5
48.9
45.7
42.1
Excellent
80
51.1
48.3
46.4
43.4
39.5
36.7
Good
60
45.4
44
42.4
39.2
35.5
32.3
Fair
40
41.7
40.5
38.5
35.6
32.3
29.4
Poor
0–40
<41.7
<40.5
<38.5
<35.6
<32.3
<29.4
Females
Percentile
20–29
30–39
40–49
50–59
60–69
70–79
Superior
95
49.6
47.4
45.3
41.1
37.8
36.7
Excellent
80
43.9
42.4
39.7
36.7
33
30.9
Good
60
39.5
37.8
36.3
33
30
28.1
Fair
40
36.1
34.4
33
30.1
27.5
25.9
Poor
0–40
<36.1
<34.4
<33
<30.1
<27.5
<25.9
Data reprinted with permission from The Cooper Institute. For more information, go to
www.CooperInstitute.org
.
Wheel Size and Circumference
The wheel size is marked on both sides of the tire. This is not a
comprehensive list. You can also use one of the calculators
available on the Internet.
Wheel Size
L (mm)
12 × 1.75
935
14 × 1.5
1020
14 × 1.75
1055
16 × 1.5
1185
16 × 1.75
1195
18 × 1.5
1340
18 × 1.75
1350
20 × 1.75
1515
20 × 1-3/8
1615
22 × 1-3/8
1770
22 × 1-1/2
1785
24 × 1
1753
24 × 3/4 Tubular
1785
24 × 1-1/8
1795
24 × 1-1/4
1905
24 × 1.75
1890
24 × 2.00
1925
24 × 2.125
1965
26 × 7/8
1920
26 × 1(59)
1913
26 × 1(65)
1952
26 × 1.25
1953
26 × 1-1/8
1970
26 × 1-3/8
2068
26 × 1-1/2
2100
Wheel Size
L (mm)
26 × 1.40
2005
26 × 1.50
2010
26 × 1.75
2023
26 × 1.95
2050
26 × 2.00
2055
26 × 2.10
2068
26 × 2.125
2070
26 × 2.35
2083
26 × 3.00
2170
27 × 1
2145
27 × 1-1/8
2155
27 × 1-1/4
2161
27 × 1-3/8
2169
650 × 35A
2090
650 × 38A
2125
650 × 38B
2105
700 × 18C
2070
700 × 19C
2080
700 × 20C
2086
700 × 23C
2096
700 × 25C
2105
700 × 28C
2136
700 × 30C
2170
700 × 32C
2155
700C Tubular
2130
700 × 35C
2168
700 × 38C
2180
700 × 40C
2200
Appendix
19