Garmin STRIKER 4 Owners Manual - Page 6
Adding the Numbers Screen, Adding the Data Graphs Screen, Full Screen Sonar, DownVü Sonar View,
 |
View all Garmin STRIKER 4 manuals
Add to My Manuals
Save this manual to your list of manuals |
Page 6 highlights
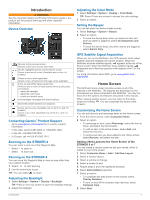
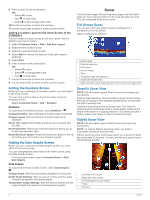
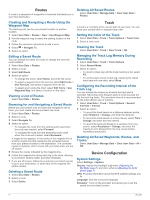
9 Enter a name for the combination. TIP: • Select to save. • Hold to clear data. • Select or to change letter case. 10Use the arrow keys to resize the windows. 11Use the arrow keys to select a home screen location. Adding a Custom Layout to the Home Screen of the STRIKER 4 You can create a custom screen to suit your needs, which is added to your home screen. 1 Select Customize Home > Add > Add New Layout. 2 Select the first function to add. 3 Select the second function to add. 4 Select Split to choose the direction of the split screens (optional). 5 Select Next. 6 Enter a name for the combination. TIP: • Select to save. • Select to change letter case. • Hold to clear data. 7 Use the arrow keys to resize the windows. 8 Use the arrow keys to select a home screen location. Adding the Numbers Screen Before you can customize the Numbers screen, you must add it to the home screen. You can view numeric data on the home screen using the Numbers screen. Select Customize Home > Add > Numbers. Numbers To customize the Numbers screen, select Numbers > . Change Numbers: Sets what type of number data is displayed. Change Layout: Sets the amount of number data that is displayed. Reset Trip: Resets the trip data and allows you to record new trip data. Reset Odometer: Resets the odometer data and allows you to record new odometer data. Reset Maximum Speed: Resets the maximum speed for the trip and allows your to record a new maximum speed. Adding the Data Graphs Screen Before you can customize the Data Graphs screen, you must add it to the home screen. You can view graphical sonar data on the home screen using the Data Graphs screen. From the home screen, select Customize Home > Add > Data Graphs. Data Graphs To customize the Data Graphs screen, select Data Graphs > . Change Graph: Sets the type of data displayed on the screen. Depth Graph Settings: Sets the amount of time and the range of depth that appear in the depth graphs. Temperature Graph Settings: Sets the amount of time and the range of depth that appear in the temperature graphs. Sonar The full screen page, the split frequency page, and the flasher page are visual representations of the area beneath your boat. You can customize these sonar views. Full Screen Sonar You can see a full-view graph of sonar readings from a transducer on the full screen. Select Traditional or DownVü. Bottom depth À Water temperature Á GPS speed  Device voltage à Time Ä Transducer type and frequency Å Suspended targets (fish) Æ Depth indicator as the sonar data the screen scrolls from right to left Ç DownVü Sonar View NOTE: Not all models support DownVü sonar technology and transducers. DownVü high-frequency sonar provides a clearer picture below the boat, providing a more detailed representation of structures the boat is passing over. Traditional transducers emit a conical beam. The DownVü scanning sonar technology emits a narrow beam, similar to the shape of the beam in a copying machine. This beam provides a clearer, picture-like image of what is beneath the boat. SideVü Sonar View NOTE: Not all models support SideVü sonar and scanning transducers. NOTE: To receive SideVü scanning sonar, you need a compatible transducer and fishfinder. SideVü scanning sonar technology shows you a picture of what lies to the sides of the boat. You can use this as a search tool to find structures and fish. Left side of the vessel À Right side of the vessel Á The transducer on your vessel  Trees à Old tires Ä 2 Sonar
-
 1
1 -
 2
2 -
 3
3 -
 4
4 -
 5
5 -
 6
6 -
 7
7 -
 8
8 -
 9
9 -
 10
10 -
 11
11 -
 12
12 -
13
-
14
-
15
-
16
 |
 |
