Garmin fenix 6 - Pro Solar Edition Owners Manual - Page 26
Body Battery
 |
View all Garmin fenix 6 - Pro Solar Edition manuals
Add to My Manuals
Save this manual to your list of manuals |
Page 26 highlights
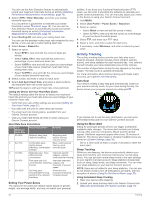
Training Load Focus In order to maximize performance and fitness gains, training should be distributed across three categories: low aerobic, high aerobic, and anaerobic. Training load focus shows you how much of your training is currently in each category and provides training targets. Training load focus requires at least 7 days of training to determine if your training load is low, optimal, or high. After 4 weeks of training history, your training load estimate will have more detailed target information to help you balance your training activities. Below targets: Your training load is lower than optimal in all intensity categories. Try increasing the duration or frequency of your workouts. Low aerobic shortage: Try adding more low aerobic activities to provide recovery and balance for your higher intensity activities. High aerobic shortage: Try adding more high aerobic activities to help improve your lactate threshold and VO2 max. over time. Anaerobic shortage: Try adding a few more intense, anaerobic activities to improve your speed and anaerobic capacity over time. Balanced: Your training load is balanced and provides allaround fitness benefits as you continue training. Low aerobic focus: Your training load is mostly low aerobic activity. This provides a solid foundation and prepares you for adding more intense workouts. High aerobic focus: Your training load is mostly high aerobic activity. These activities help to improve lactate threshold, VO2 max., and endurance. Anaerobic focus: Your training load is mostly intense activity. This leads to rapid fitness gains, but should be balanced with low aerobic activities. Above targets: Your training load is higher than optimal, and you should consider scaling back the duration and frequency of your workouts. Recovery Time You can use your Garmin device with wrist-based heart rate or a compatible chest heart rate monitor to display how much time remains before you are fully recovered and ready for the next hard workout. NOTE: The recovery time recommendation uses your VO2 max. estimate and may seem inaccurate at first. The device requires you to complete a few activities to learn about your performance. The recovery time appears immediately following an activity. The time counts down until it is optimal for you to attempt another hard workout. Viewing Your Recovery Time For the most accurate estimate, complete the user profile setup (Setting Up Your User Profile, page 21), and set your maximum heart rate (Setting Your Heart Rate Zones, page 21). 1 Go for a run. 2 After your run, select Save. The recovery time appears. The maximum time is 4 days. NOTE: From the watch face, you can select UP or DOWN to view the training status widget, and select to scroll through the metrics to view your recovery time. Recovery Heart Rate If you are training with wrist-based heart rate or a compatible chest heart rate monitor, you can check your recovery heart rate value after each activity. Recovery heart rate is the difference between your exercising heart rate and your heart rate two minutes after the exercise has stopped. For example, after a typical training run, you stop the timer. Your heart rate is 140 bpm. After two minutes of no activity or cool down, your heart rate is 90 bpm. Your recovery heart rate is 50 bpm (140 minus 90). Some studies have linked recovery heart rate to cardiac health. Higher numbers generally indicate healthier hearts. TIP: For best results, you should stop moving for two minutes while the device calculates your recovery heart rate value. You can save or discard the activity after this value appears. Body Battery™ Your device analyzes your heart rate variability, stress level, sleep quality, and activity data to determine your overall Body Battery level. Like a gas gauge on a car, it indicates your amount of available reserve energy. The Body Battery level range is from 0 to 100, where 0 to 25 is low reserve energy, 26 to 50 is medium reserve energy, 51 to 75 is high reserve energy, and 76 to 100 is very high reserve energy. You can sync your device with your Garmin Connect account to view your most up-to-date Body Battery level, long-term trends, and additional details (Tips for Improved Body Battery Data, page 20). Viewing the Body Battery Widget The Body Battery widget displays your current Body Battery level and a graph of your Body Battery level for the last several hours. 1 Press UP or DOWN to view the Body Battery widget. NOTE: You may need to add the widget to your widget loop (Customizing the Widget Loop, page 34). 2 Press to view a graph of your body battery level for the last four hours. 3 Press DOWN to view a combined graph of your Body Battery and stress levels. Blue bars indicate periods of rest. Orange bars indicate periods of stress. Gray bars indicate times when you were too active to determine your stress level. 4 Press DOWN to see your Body Battery data since midnight. Tips for Improved Body Battery Data • Your Body Battery level updates when you sync your device with your Garmin Connect account. • For more accurate results, wear the device while sleeping. • Rest and good sleep charge your Body Battery. • Strenuous activity, high stress, and poor sleep can cause your Body Battery to drain. • Food intake, as well as stimulants like caffeine, has no impact on your Body Battery. Pulse Oximeter The fēnix device has a wrist-based pulse oximeter to gauge the peripheral saturation of oxygen in your blood. Knowing your oxygen saturation can help you determine how your body is acclimating to high altitudes for alpine sport and expedition. You can manually begin a pulse oximeter reading by viewing the pulse oximeter widget (Getting Pulse Oximeter Readings, page 21). You can also turn on all-day readings (Turning On All-Day Pulse Oximeter Readings, page 21). When you remain motionless, your device analyzes your oxygen saturation and your elevation. The elevation profile helps indicate how your pulse oximeter readings are changing, relative to your to elevation. On the device, your pulse oximeter reading appears as an oxygen saturation percentage and color on the graph. On your Garmin Connect account, you can view additional details about your pulse oximeter readings, including trends over multiple days. 20 Pulse Oximeter
-
 1
1 -
2
-
3
-
4
-
5
-
6
-
7
-
8
-
9
-
10
-
11
-
12
-
13
-
14
-
15
-
16
-
17
-
18
-
19
-
20
-
 21
21 -
 22
22 -
 23
23 -
 24
24 -
 25
25 -
 26
26 -
 27
27 -
 28
28 -
 29
29 -
 30
30 -
 31
31 -
32
-
33
-
34
-
35
-
36
-
37
-
38
-
39
-
40
-
41
-
42
-
43
-
44
-
45
-
46
-
47
-
48
-
49
-
50
-
51
-
52
-
53
-
54
-
55
-
56
-
57
-
58
 |
 |