HP 39GS HP 39gs_40gs_Mastering The Graphing Calculator_English_E_F2224-90010.p - Page 130
A caveat for bivariate data, Predicting using PREDY, User Defined
 |
UPC - 808736931328
View all HP 39GS manuals
Add to My Manuals
Save this manual to your list of manuals |
Page 130 highlights
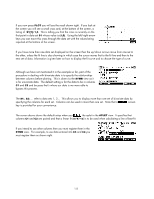
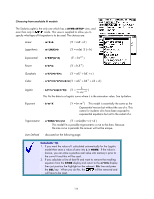
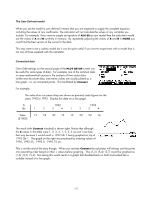
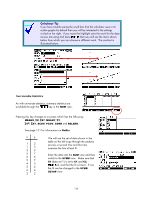
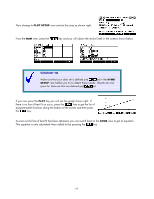
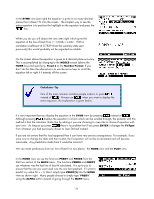
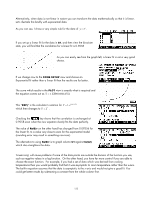
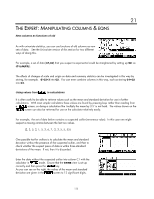
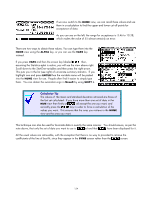
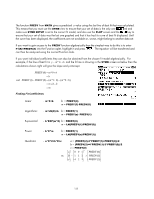
In the SYMB view (see right) the equation is given to so many decimal places that it doesn't fit onto the screen. The simplest way to see the entire equation is to position the highlight on the equation and press the key. When you do you will obtain the view seen right which gives the equation of the line of best fit as yˆ = 0.8199x +1.1662 . With a correlation coefficient of 0.7829 (from the summary stats seen previously) this would probably not be regarded as reliable. On the screen above the equation is given to 4 decimal place accuracy. This is accomplished by changing to the MODES screen (above the HOME key) and specifying Fixed 4 as the Number Format. If you don't do this then the alternative is to use the arrow keys to scroll the equation left or right if it extends off the screen. A caveat for bivariate data Calculator Tip One of the most common mistakes people make is to press instead of . Always use when you want to display the entire equation. An explanation is given below. It is very important that you display the equation in the SYMB view by pressing instead of . Although pressing displays the equation in a form which can be scrolled through, the problem with this method is that the calculator thinks that by editing it you are choosing to over-ride its choice of equation with your own. As long as you press there is no problem but if you press ENTER it changes the FitType from whatever you had previously chosen to User Defined instead. If you are not aware that this has happened then it can have very serious consequences. For example, if you were now to change the data and then re-plot, the fit equation will not be re-calculated and will become inaccurate. Any predictions made from it would be incorrect. We can make predictions from our line of best fit in two places - the HOME view and the PLOT view. Predicting using PREDY In the HOME view we use the functions PREDY and PREDX from the Stat-Two section of the MATH menu. The functions PREDX and PREDY use whatever was the last line of best fit calculated. It is up to you to ensure that the one you want used was the one last graphed. If I want to predict a y value for x = 3, then I simply type PREDY(3) into the HOME view as shown right. Many people choose to simply type 'PREDY' using the ALPHA button instead of going through the MATH menu. 130
-
 1
1 -
2
-
3
-
4
-
5
-
6
-
7
-
8
-
9
-
10
-
11
-
12
-
13
-
14
-
15
-
16
-
17
-
18
-
19
-
20
-
21
-
22
-
23
-
24
-
25
-
26
-
27
-
28
-
29
-
30
-
31
-
32
-
33
-
34
-
35
-
36
-
37
-
38
-
39
-
40
-
41
-
42
-
43
-
44
-
45
-
46
-
47
-
48
-
49
-
50
-
51
-
52
-
53
-
54
-
55
-
56
-
57
-
58
-
59
-
60
-
61
-
62
-
63
-
64
-
65
-
66
-
67
-
68
-
69
-
70
-
71
-
72
-
73
-
74
-
75
-
76
-
77
-
78
-
79
-
80
-
81
-
82
-
83
-
84
-
85
-
86
-
87
-
88
-
89
-
90
-
91
-
92
-
93
-
94
-
95
-
96
-
97
-
98
-
99
-
100
-
101
-
102
-
103
-
104
-
105
-
106
-
107
-
108
-
109
-
110
-
111
-
112
-
113
-
114
-
115
-
116
-
117
-
118
-
119
-
120
-
121
-
122
-
123
-
124
-
 125
125 -
 126
126 -
 127
127 -
 128
128 -
 129
129 -
 130
130 -
 131
131 -
 132
132 -
 133
133 -
 134
134 -
 135
135 -
136
-
137
-
138
-
139
-
140
-
141
-
142
-
143
-
144
-
145
-
146
-
147
-
148
-
149
-
150
-
151
-
152
-
153
-
154
-
155
-
156
-
157
-
158
-
159
-
160
-
161
-
162
-
163
-
164
-
165
-
166
-
167
-
168
-
169
-
170
-
171
-
172
-
173
-
174
-
175
-
176
-
177
-
178
-
179
-
180
-
181
-
182
-
183
-
184
-
185
-
186
-
187
-
188
-
189
-
190
-
191
-
192
-
193
-
194
-
195
-
196
-
197
-
198
-
199
-
200
-
201
-
202
-
203
-
204
-
205
-
206
-
207
-
208
-
209
-
210
-
211
-
212
-
213
-
214
-
215
-
216
-
217
-
218
-
219
-
220
-
221
-
222
-
223
-
224
-
225
-
226
-
227
-
228
-
229
-
230
-
231
-
232
-
233
-
234
-
235
-
236
-
237
-
238
-
239
-
240
-
241
-
242
-
243
-
244
-
245
-
246
-
247
-
248
-
249
-
250
-
251
-
252
-
253
-
254
-
255
-
256
-
257
-
258
-
259
-
260
-
261
-
262
-
263
-
264
-
265
-
266
-
267
-
268
-
269
-
270
-
271
-
272
-
273
-
274
-
275
-
276
-
277
-
278
-
279
-
280
-
281
-
282
-
283
-
284
-
285
-
286
-
287
-
288
-
289
-
290
-
291
-
292
-
293
-
294
-
295
-
296
-
297
-
298
-
299
-
300
-
301
-
302
-
303
-
304
-
305
-
306
-
307
-
308
-
309
-
310
-
311
-
312
-
313
-
314
-
315
-
316
-
317
-
318
-
319
-
320
-
321
-
322
-
323
-
324
-
325
-
326
-
327
-
328
-
329
-
330
-
331
-
332
-
333
-
334
-
335
-
336
-
337
-
338
-
339
-
340
-
341
-
342
-
343
-
344
-
345
-
346
-
347
-
348
-
349
-
350
-
351
-
352
-
353
-
354
-
355
-
356
-
357
-
358
-
359
-
360
-
361
-
362
-
363
-
364
-
365
-
366
 |
 |
