HP 39GS HP 39gs_40gs_Mastering The Graphing Calculator_English_E_F2224-90010.p - Page 145
Hypothesis test: Z-Test 1-, of being incorrect.
 |
UPC - 808736931328
View all HP 39GS manuals
Add to My Manuals
Save this manual to your list of manuals |
Page 145 highlights
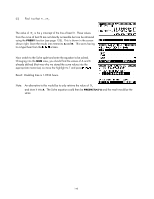
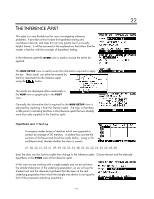
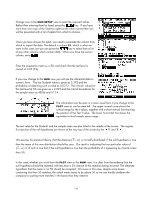
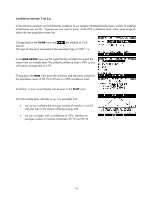
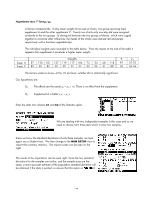
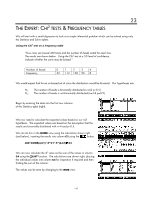
The NUM view shows the critical values. We can see that the probability of obtaining a test student-t value of 3.38 is 0.0015 and this is well below the permitted test level of 1%. The PLOT view also shows that the vertical line representing the value of x1 − x2 or ∆x is well into the region of rejection indicated by the R . From the evidence we should reject the null hypothesis and accept instead that the average weight of the group receiving supplement A is significantly higher than those receiving supplement C with only a 1% chance of being incorrect. Hypothesis test: Z-Test 1-µ A teacher has developed a new teaching technique for hearing-impaired students which he believes is producing significantly better results. He wishes to publish a paper on this and needs to check his results statistically. A standardized test is available for which it is known that the normal performance of hearing-impaired students at the same stage of study has a mean of 53.6% and a standard deviation of 12.2%. When he applies this test to his class of 23 students their scores are shown below. The teacher believes that this data shows that his students are scoring significantly better and wishes to test this at a level of 5%. Test results: {57, 72, 42, 50, 55, 58, 59, 38, 45,53, 77,57, 52, 69, 50, 55, 59, 68, 62, 63, 53, 56} As usual we begin by entering the data into column C1 of the Statistics aplet. Changing to the Inference aplet, we choose a Hypothesis test using Ztest: 1 µ, since we know the population standard deviation. 145
-
 1
1 -
2
-
3
-
4
-
5
-
6
-
7
-
8
-
9
-
10
-
11
-
12
-
13
-
14
-
15
-
16
-
17
-
18
-
19
-
20
-
21
-
22
-
23
-
24
-
25
-
26
-
27
-
28
-
29
-
30
-
31
-
32
-
33
-
34
-
35
-
36
-
37
-
38
-
39
-
40
-
41
-
42
-
43
-
44
-
45
-
46
-
47
-
48
-
49
-
50
-
51
-
52
-
53
-
54
-
55
-
56
-
57
-
58
-
59
-
60
-
61
-
62
-
63
-
64
-
65
-
66
-
67
-
68
-
69
-
70
-
71
-
72
-
73
-
74
-
75
-
76
-
77
-
78
-
79
-
80
-
81
-
82
-
83
-
84
-
85
-
86
-
87
-
88
-
89
-
90
-
91
-
92
-
93
-
94
-
95
-
96
-
97
-
98
-
99
-
100
-
101
-
102
-
103
-
104
-
105
-
106
-
107
-
108
-
109
-
110
-
111
-
112
-
113
-
114
-
115
-
116
-
117
-
118
-
119
-
120
-
121
-
122
-
123
-
124
-
125
-
126
-
127
-
128
-
129
-
130
-
131
-
132
-
133
-
134
-
135
-
136
-
137
-
138
-
139
-
 140
140 -
 141
141 -
 142
142 -
 143
143 -
 144
144 -
 145
145 -
 146
146 -
 147
147 -
 148
148 -
 149
149 -
 150
150 -
151
-
152
-
153
-
154
-
155
-
156
-
157
-
158
-
159
-
160
-
161
-
162
-
163
-
164
-
165
-
166
-
167
-
168
-
169
-
170
-
171
-
172
-
173
-
174
-
175
-
176
-
177
-
178
-
179
-
180
-
181
-
182
-
183
-
184
-
185
-
186
-
187
-
188
-
189
-
190
-
191
-
192
-
193
-
194
-
195
-
196
-
197
-
198
-
199
-
200
-
201
-
202
-
203
-
204
-
205
-
206
-
207
-
208
-
209
-
210
-
211
-
212
-
213
-
214
-
215
-
216
-
217
-
218
-
219
-
220
-
221
-
222
-
223
-
224
-
225
-
226
-
227
-
228
-
229
-
230
-
231
-
232
-
233
-
234
-
235
-
236
-
237
-
238
-
239
-
240
-
241
-
242
-
243
-
244
-
245
-
246
-
247
-
248
-
249
-
250
-
251
-
252
-
253
-
254
-
255
-
256
-
257
-
258
-
259
-
260
-
261
-
262
-
263
-
264
-
265
-
266
-
267
-
268
-
269
-
270
-
271
-
272
-
273
-
274
-
275
-
276
-
277
-
278
-
279
-
280
-
281
-
282
-
283
-
284
-
285
-
286
-
287
-
288
-
289
-
290
-
291
-
292
-
293
-
294
-
295
-
296
-
297
-
298
-
299
-
300
-
301
-
302
-
303
-
304
-
305
-
306
-
307
-
308
-
309
-
310
-
311
-
312
-
313
-
314
-
315
-
316
-
317
-
318
-
319
-
320
-
321
-
322
-
323
-
324
-
325
-
326
-
327
-
328
-
329
-
330
-
331
-
332
-
333
-
334
-
335
-
336
-
337
-
338
-
339
-
340
-
341
-
342
-
343
-
344
-
345
-
346
-
347
-
348
-
349
-
350
-
351
-
352
-
353
-
354
-
355
-
356
-
357
-
358
-
359
-
360
-
361
-
362
-
363
-
364
-
365
-
366
 |
 |
