HP 39GS HP 39gs_40gs_Mastering The Graphing Calculator_English_E_F2224-90010.p - Page 96
Vectors, Example 1
 |
UPC - 808736931328
View all HP 39GS manuals
Add to My Manuals
Save this manual to your list of manuals |
Page 96 highlights
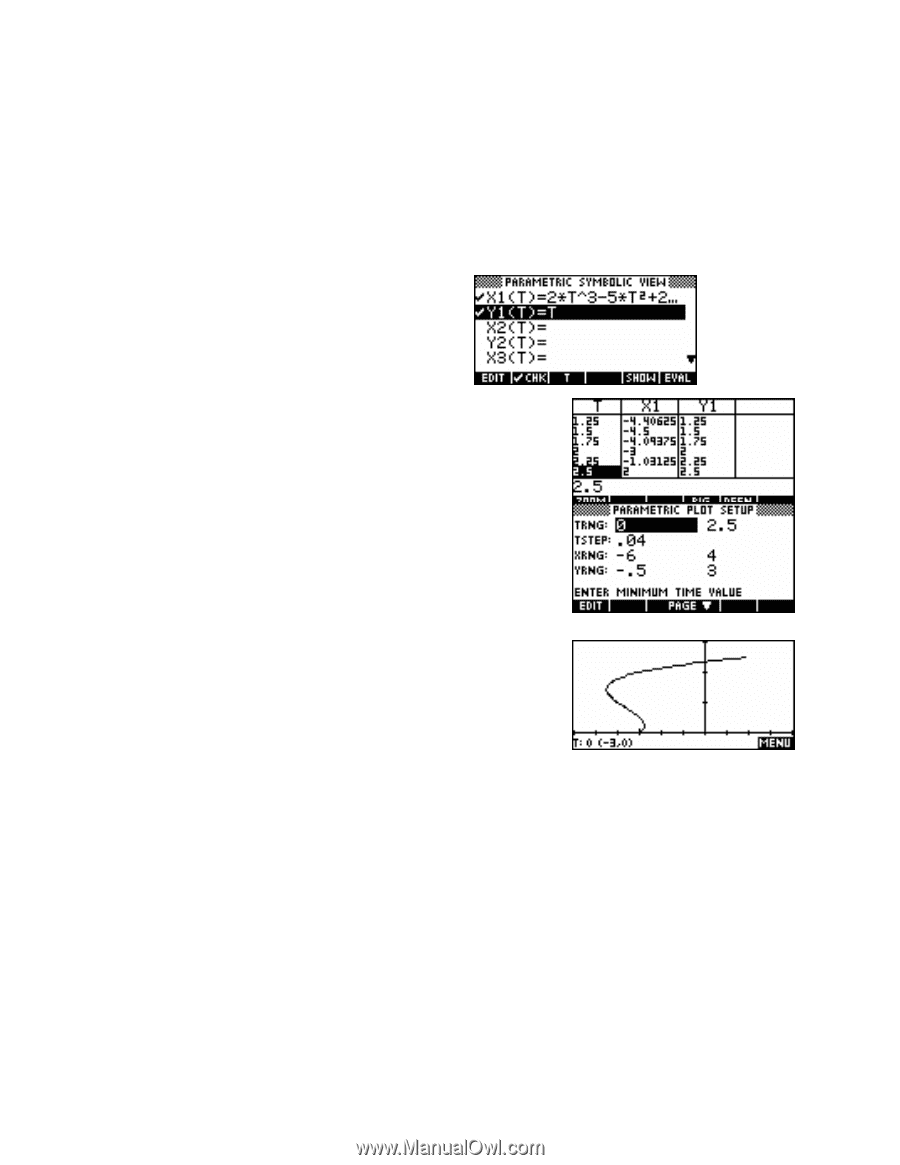
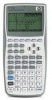
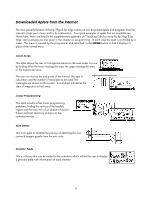
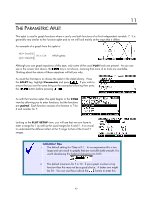
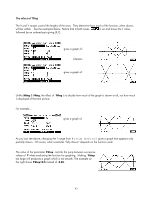
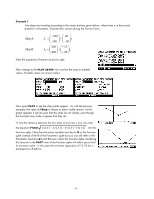
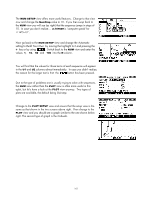
Vectors The Parametric aplet can be used to visually display vector motion in one and two dimensions. Example 1 A particle P is moving in a straight line. Its velocity v (in ms-1) at any time t (in seconds, t>0) is given by v(t) = 2t3 − 5t2 + 2t − 3 . Illustrate its motion during the first 2.5 seconds. Enter the motion equation from (v) as X(T) and enter Y(T)=T. The only purpose of this second equation is to move the particle up the y axis as it traces out its path, thereby making it easier to view. Changing to the NUM view lets me scroll through the first three seconds of movement, allowing me to choose a good scale for the x axis. I'm interested in the first 2½ seconds only, so I'll also restrict TRng to 0 to 2.5. Using Y(T)=T for this TRng means the y values will also range from 0 to 2.5. Maximizing visibility of this range of values is the reason for setting YRng to be -0.5 to 3 in PLOT SETUP. The range for the x axis is chosen from the values shown in the NUM view . The value of TStep is carefully chosen so that when the motion plots, the speed is slow enough to show its progress. The graph makes it plain that it doubles back twice in the first two seconds. The really nice part about this method though is that the motion can be seen on the screen. As the particle slows down near the turning points it does so on the screen. As it accelerates in the final section you can see this on the screen too. Obviously this can't be seen on this page, and I recommend you try this for yourself. 96
-
 1
1 -
2
-
3
-
4
-
5
-
6
-
7
-
8
-
9
-
10
-
11
-
12
-
13
-
14
-
15
-
16
-
17
-
18
-
19
-
20
-
21
-
22
-
23
-
24
-
25
-
26
-
27
-
28
-
29
-
30
-
31
-
32
-
33
-
34
-
35
-
36
-
37
-
38
-
39
-
40
-
41
-
42
-
43
-
44
-
45
-
46
-
47
-
48
-
49
-
50
-
51
-
52
-
53
-
54
-
55
-
56
-
57
-
58
-
59
-
60
-
61
-
62
-
63
-
64
-
65
-
66
-
67
-
68
-
69
-
70
-
71
-
72
-
73
-
74
-
75
-
76
-
77
-
78
-
79
-
80
-
81
-
82
-
83
-
84
-
85
-
86
-
87
-
88
-
89
-
90
-
 91
91 -
 92
92 -
 93
93 -
 94
94 -
 95
95 -
 96
96 -
 97
97 -
 98
98 -
 99
99 -
 100
100 -
 101
101 -
102
-
103
-
104
-
105
-
106
-
107
-
108
-
109
-
110
-
111
-
112
-
113
-
114
-
115
-
116
-
117
-
118
-
119
-
120
-
121
-
122
-
123
-
124
-
125
-
126
-
127
-
128
-
129
-
130
-
131
-
132
-
133
-
134
-
135
-
136
-
137
-
138
-
139
-
140
-
141
-
142
-
143
-
144
-
145
-
146
-
147
-
148
-
149
-
150
-
151
-
152
-
153
-
154
-
155
-
156
-
157
-
158
-
159
-
160
-
161
-
162
-
163
-
164
-
165
-
166
-
167
-
168
-
169
-
170
-
171
-
172
-
173
-
174
-
175
-
176
-
177
-
178
-
179
-
180
-
181
-
182
-
183
-
184
-
185
-
186
-
187
-
188
-
189
-
190
-
191
-
192
-
193
-
194
-
195
-
196
-
197
-
198
-
199
-
200
-
201
-
202
-
203
-
204
-
205
-
206
-
207
-
208
-
209
-
210
-
211
-
212
-
213
-
214
-
215
-
216
-
217
-
218
-
219
-
220
-
221
-
222
-
223
-
224
-
225
-
226
-
227
-
228
-
229
-
230
-
231
-
232
-
233
-
234
-
235
-
236
-
237
-
238
-
239
-
240
-
241
-
242
-
243
-
244
-
245
-
246
-
247
-
248
-
249
-
250
-
251
-
252
-
253
-
254
-
255
-
256
-
257
-
258
-
259
-
260
-
261
-
262
-
263
-
264
-
265
-
266
-
267
-
268
-
269
-
270
-
271
-
272
-
273
-
274
-
275
-
276
-
277
-
278
-
279
-
280
-
281
-
282
-
283
-
284
-
285
-
286
-
287
-
288
-
289
-
290
-
291
-
292
-
293
-
294
-
295
-
296
-
297
-
298
-
299
-
300
-
301
-
302
-
303
-
304
-
305
-
306
-
307
-
308
-
309
-
310
-
311
-
312
-
313
-
314
-
315
-
316
-
317
-
318
-
319
-
320
-
321
-
322
-
323
-
324
-
325
-
326
-
327
-
328
-
329
-
330
-
331
-
332
-
333
-
334
-
335
-
336
-
337
-
338
-
339
-
340
-
341
-
342
-
343
-
344
-
345
-
346
-
347
-
348
-
349
-
350
-
351
-
352
-
353
-
354
-
355
-
356
-
357
-
358
-
359
-
360
-
361
-
362
-
363
-
364
-
365
-
366
 |
 |