HP 39GS HP 39gs_40gs_Mastering The Graphing Calculator_English_E_F2224-90010.p - Page 89
Auto Scale, Decimal, Integer & Trig, first
 |
UPC - 808736931328
View all HP 39GS manuals
Add to My Manuals
Save this manual to your list of manuals |
Page 89 highlights
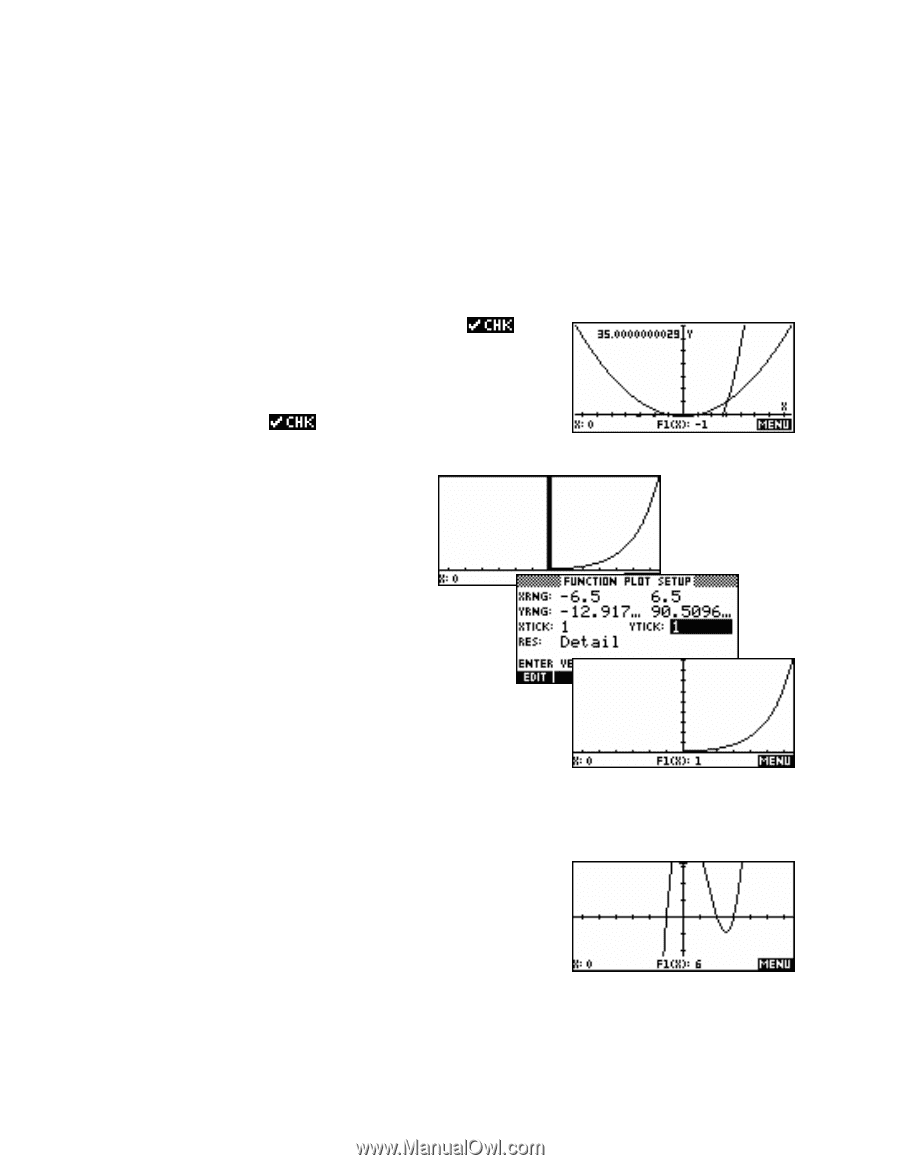
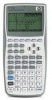
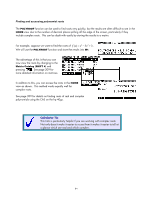
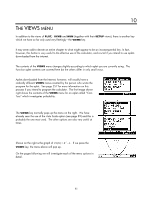
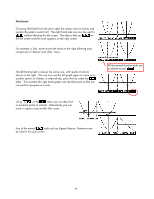
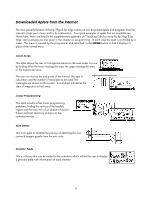
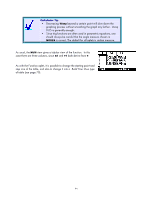
Auto Scale Auto Scale is an good way to ensure that you get a reasonable picture of the graph if you are not sure in advance of the scale. After using Auto Scale you can then use the PLOT SETUP view to adjust the results. It is important to understand two points about how Auto Scale works. 1. Auto Scale uses the X-axis range that is currently chosen in PLOT SETUP. It then adjusts the Y-axis range to include as much of the graph as possible. It will not adjust the x axis. 2. Auto Scale is done only for the first graph with a . If there are other graphs and they don't fit the scale then they will not benefit. As you can see in the example shown right, the quadratic shows well but the second graph (a cubic) shows only an ascending section. Zooming out would be an option at this stage, as would un- ing the quadratic in the hopes that Auto Scaling the cubic might give better results. The resulting y scale is often not a very 'nice' one. Commonly you will find that the y axis appears 'thick' as shown right. The reason for this is that the Ytick value is too small, resulting in ticks too close together. You will usually have to adjust it in the PLOT SETUP view to make it look good. The third graph has a Ytick value of 10 instead of 1. Decimal, Integer & Trig The next option of Decimal resets the scales so that each pixel (dot on the screen) is exactly 0.1. The result is an X scale of −6 ⋅ 5 ≤ x ≤ 6 ⋅ 5 and a Y scale of −3 ⋅1 ≤ y ≤ 3 ⋅ 2 . This may not give the best view of the function. Personally I don't often use it, as it is generally easier to go to the PLOT SETUP view and press SHIFT CLEAR, which restores the factory settings to all fields. 89
-
 1
1 -
2
-
3
-
4
-
5
-
6
-
7
-
8
-
9
-
10
-
11
-
12
-
13
-
14
-
15
-
16
-
17
-
18
-
19
-
20
-
21
-
22
-
23
-
24
-
25
-
26
-
27
-
28
-
29
-
30
-
31
-
32
-
33
-
34
-
35
-
36
-
37
-
38
-
39
-
40
-
41
-
42
-
43
-
44
-
45
-
46
-
47
-
48
-
49
-
50
-
51
-
52
-
53
-
54
-
55
-
56
-
57
-
58
-
59
-
60
-
61
-
62
-
63
-
64
-
65
-
66
-
67
-
68
-
69
-
70
-
71
-
72
-
73
-
74
-
75
-
76
-
77
-
78
-
79
-
80
-
81
-
82
-
83
-
 84
84 -
 85
85 -
 86
86 -
 87
87 -
 88
88 -
 89
89 -
 90
90 -
 91
91 -
 92
92 -
 93
93 -
 94
94 -
95
-
96
-
97
-
98
-
99
-
100
-
101
-
102
-
103
-
104
-
105
-
106
-
107
-
108
-
109
-
110
-
111
-
112
-
113
-
114
-
115
-
116
-
117
-
118
-
119
-
120
-
121
-
122
-
123
-
124
-
125
-
126
-
127
-
128
-
129
-
130
-
131
-
132
-
133
-
134
-
135
-
136
-
137
-
138
-
139
-
140
-
141
-
142
-
143
-
144
-
145
-
146
-
147
-
148
-
149
-
150
-
151
-
152
-
153
-
154
-
155
-
156
-
157
-
158
-
159
-
160
-
161
-
162
-
163
-
164
-
165
-
166
-
167
-
168
-
169
-
170
-
171
-
172
-
173
-
174
-
175
-
176
-
177
-
178
-
179
-
180
-
181
-
182
-
183
-
184
-
185
-
186
-
187
-
188
-
189
-
190
-
191
-
192
-
193
-
194
-
195
-
196
-
197
-
198
-
199
-
200
-
201
-
202
-
203
-
204
-
205
-
206
-
207
-
208
-
209
-
210
-
211
-
212
-
213
-
214
-
215
-
216
-
217
-
218
-
219
-
220
-
221
-
222
-
223
-
224
-
225
-
226
-
227
-
228
-
229
-
230
-
231
-
232
-
233
-
234
-
235
-
236
-
237
-
238
-
239
-
240
-
241
-
242
-
243
-
244
-
245
-
246
-
247
-
248
-
249
-
250
-
251
-
252
-
253
-
254
-
255
-
256
-
257
-
258
-
259
-
260
-
261
-
262
-
263
-
264
-
265
-
266
-
267
-
268
-
269
-
270
-
271
-
272
-
273
-
274
-
275
-
276
-
277
-
278
-
279
-
280
-
281
-
282
-
283
-
284
-
285
-
286
-
287
-
288
-
289
-
290
-
291
-
292
-
293
-
294
-
295
-
296
-
297
-
298
-
299
-
300
-
301
-
302
-
303
-
304
-
305
-
306
-
307
-
308
-
309
-
310
-
311
-
312
-
313
-
314
-
315
-
316
-
317
-
318
-
319
-
320
-
321
-
322
-
323
-
324
-
325
-
326
-
327
-
328
-
329
-
330
-
331
-
332
-
333
-
334
-
335
-
336
-
337
-
338
-
339
-
340
-
341
-
342
-
343
-
344
-
345
-
346
-
347
-
348
-
349
-
350
-
351
-
352
-
353
-
354
-
355
-
356
-
357
-
358
-
359
-
360
-
361
-
362
-
363
-
364
-
365
-
366
 |
 |