HP ProLiant BL620c OneCommand Manager Application User Manual (P004343-01A Ver - Page 60
Viewing Port Statistics, Viewing Fibre Channel Port Statistics
 |
View all HP ProLiant BL620c manuals
Add to My Manuals
Save this manual to your list of manuals |
Page 60 highlights
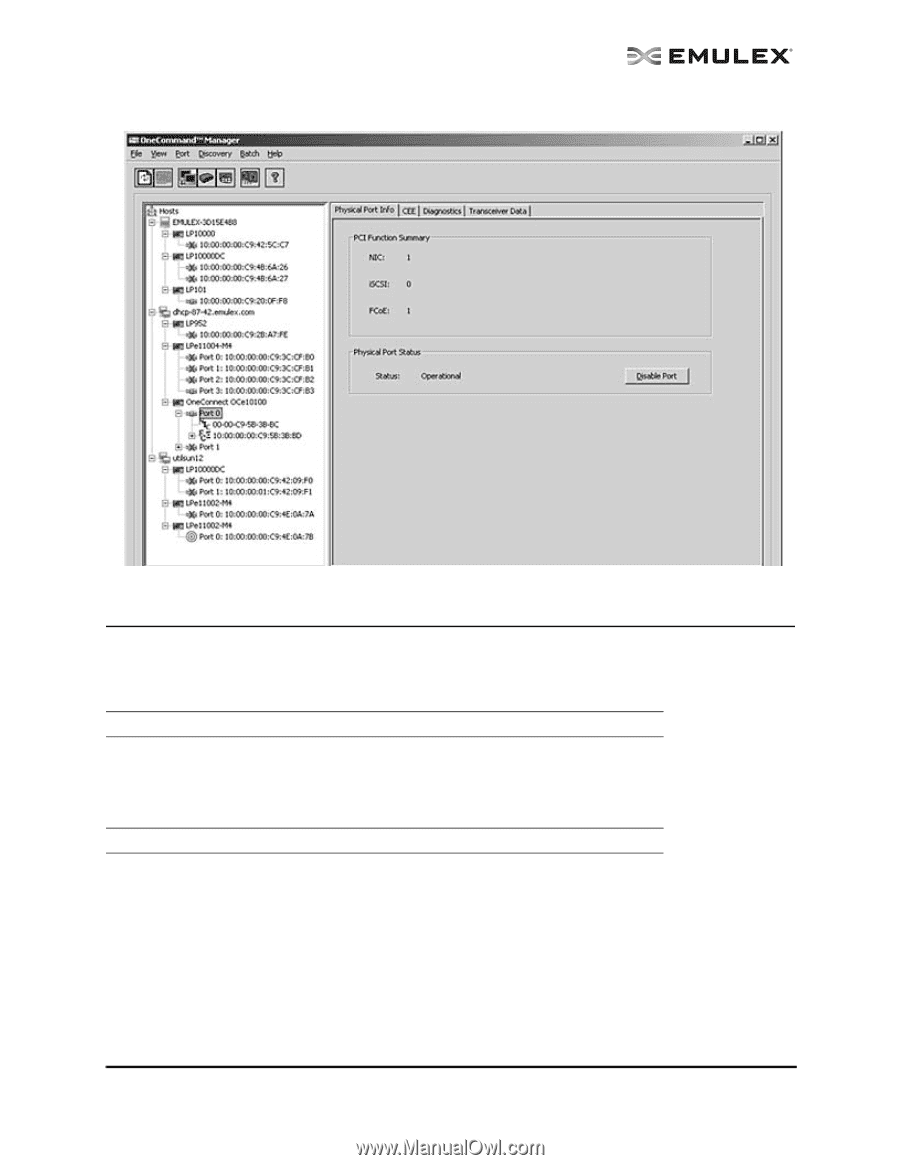
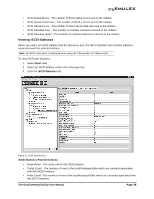
3. Select the Physical Port Info tab. Figure 23: Physical Port Info tab Viewing Port Statistics The Statistics tab provides cumulative totals for various error events and statistics on the port. Some statistics are cleared when the adapter is reset. The Port Statistics information that is displayed depends upon the type of adapter you select, Fibre Channel, iSCSI or NIC-Only. Note: Not all information is displayed on systems using CIM provider v1.2.1 on ESX 3i. Viewing Fibre Channel Port Statistics When you select a Fibre Channel adapter from the discovery-tree, the Port Statistics tab contains statistics associated with the selected Fibre Channel port. Note: Not all information is displayed on systems using CIM provider v1.2.1 on ESX 3i. To view Fibre Channel port statistics: 1. Select Host or Fabric view. 2. Select a Fibre Channel adapter port in the discovery-tree. The OneCommand Utility User Manual Page 53
-
 1
1 -
2
-
3
-
4
-
5
-
6
-
7
-
8
-
9
-
10
-
11
-
12
-
13
-
14
-
15
-
16
-
17
-
18
-
19
-
20
-
21
-
22
-
23
-
24
-
25
-
26
-
27
-
28
-
29
-
30
-
31
-
32
-
33
-
34
-
35
-
36
-
37
-
38
-
39
-
40
-
41
-
42
-
43
-
44
-
45
-
46
-
47
-
48
-
49
-
50
-
51
-
52
-
53
-
54
-
 55
55 -
 56
56 -
 57
57 -
 58
58 -
 59
59 -
 60
60 -
 61
61 -
 62
62 -
 63
63 -
 64
64 -
 65
65 -
66
-
67
-
68
-
69
-
70
-
71
-
72
-
73
-
74
-
75
-
76
-
77
-
78
-
79
-
80
-
81
-
82
-
83
-
84
-
85
-
86
-
87
-
88
-
89
-
90
-
91
-
92
-
93
-
94
-
95
-
96
-
97
-
98
-
99
-
100
-
101
-
102
-
103
-
104
-
105
-
106
-
107
-
108
-
109
-
110
-
111
-
112
-
113
-
114
-
115
-
116
-
117
-
118
-
119
-
120
-
121
-
122
-
123
-
124
-
125
-
126
-
127
-
128
-
129
-
130
-
131
-
132
-
133
-
134
-
135
-
136
-
137
-
138
-
139
-
140
-
141
-
142
-
143
-
144
-
145
-
146
-
147
-
148
-
149
-
150
-
151
-
152
-
153
-
154
-
155
-
156
-
157
-
158
-
159
-
160
-
161
-
162
-
163
-
164
-
165
-
166
-
167
-
168
-
169
-
170
-
171
-
172
-
173
-
174
-
175
-
176
-
177
-
178
-
179
-
180
-
181
-
182
-
183
-
184
-
185
-
186
-
187
-
188
-
189
-
190
-
191
-
192
-
193
-
194
-
195
-
196
-
197
-
198
-
199
-
200
-
201
-
202
-
203
-
204
-
205
-
206
-
207
-
208
-
209
-
210
-
211
-
212
-
213
-
214
-
215
-
216
-
217
-
218
-
219
-
220
-
221
-
222
-
223
 |
 |