Lenovo ThinkServer RD330 MegaRAID SAS Software User Guide - Page 258
Monitoring Controllers, Monitoring Drives, Monitoring Virtual Drives, Monitoring System Events,
 |
View all Lenovo ThinkServer RD330 manuals
Add to My Manuals
Save this manual to your list of manuals |
Page 258 highlights
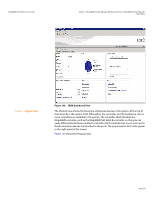
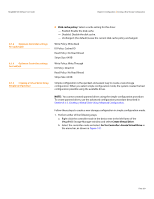
Chapter 7: MegaRAID Storage Manager Window and Menus | MegaRAID Storage Manager Main Menu MegaRAID SAS Software User Guide 7.2.2 Tabs Properties/Graphical View A yellow circle to the right of an icon indicates that a device is running in a partially degraded state. For example, this icon indicates that a virtual drive is running in a degraded state because a drive has failed: . The right panel of the MegaRAID Storage Manager window has one tab or two tabs, depending on which kind of device you select in the left panel. Figure 140 shows the MSM main menu. The Properties tab displays information about the selected device. For example, if you select a controller icon in the left panel, the Properties tab lists information about the controller, such as the controller name, NVRAM size, and device port count. For more information, see Section 9.3, Monitoring Controllers Section 9.4, Monitoring Drives, and Section 9.6, Monitoring Virtual Drives. The Graphical View tab displays information about the temperature, fans, power supplies, and voltage sensors.To display a graphical view of a drive, click an enclosure icon in the left panel of the MegaRAID Storage Manager window, and click the Graphical View tab. 7.2.3 Event Log Panel Page 258 Figure 140: Properties Tab and Graphical View Tab The lower part of the MegaRAID Storage Manager window displays the system event log entries. New event log entries appear during the session. Each entry has an ID, an error level indicating the severity of the event, the timestamp and date, and a brief description of the event. For more information about the event log, see Section 9.1, Monitoring System Events For more information about the event log entries, see Appendix A, Events and Messages.
-
 1
1 -
2
-
3
-
4
-
5
-
6
-
7
-
8
-
9
-
10
-
11
-
12
-
13
-
14
-
15
-
16
-
17
-
18
-
19
-
20
-
21
-
22
-
23
-
24
-
25
-
26
-
27
-
28
-
29
-
30
-
31
-
32
-
33
-
34
-
35
-
36
-
37
-
38
-
39
-
40
-
41
-
42
-
43
-
44
-
45
-
46
-
47
-
48
-
49
-
50
-
51
-
52
-
53
-
54
-
55
-
56
-
57
-
58
-
59
-
60
-
61
-
62
-
63
-
64
-
65
-
66
-
67
-
68
-
69
-
70
-
71
-
72
-
73
-
74
-
75
-
76
-
77
-
78
-
79
-
80
-
81
-
82
-
83
-
84
-
85
-
86
-
87
-
88
-
89
-
90
-
91
-
92
-
93
-
94
-
95
-
96
-
97
-
98
-
99
-
100
-
101
-
102
-
103
-
104
-
105
-
106
-
107
-
108
-
109
-
110
-
111
-
112
-
113
-
114
-
115
-
116
-
117
-
118
-
119
-
120
-
121
-
122
-
123
-
124
-
125
-
126
-
127
-
128
-
129
-
130
-
131
-
132
-
133
-
134
-
135
-
136
-
137
-
138
-
139
-
140
-
141
-
142
-
143
-
144
-
145
-
146
-
147
-
148
-
149
-
150
-
151
-
152
-
153
-
154
-
155
-
156
-
157
-
158
-
159
-
160
-
161
-
162
-
163
-
164
-
165
-
166
-
167
-
168
-
169
-
170
-
171
-
172
-
173
-
174
-
175
-
176
-
177
-
178
-
179
-
180
-
181
-
182
-
183
-
184
-
185
-
186
-
187
-
188
-
189
-
190
-
191
-
192
-
193
-
194
-
195
-
196
-
197
-
198
-
199
-
200
-
201
-
202
-
203
-
204
-
205
-
206
-
207
-
208
-
209
-
210
-
211
-
212
-
213
-
214
-
215
-
216
-
217
-
218
-
219
-
220
-
221
-
222
-
223
-
224
-
225
-
226
-
227
-
228
-
229
-
230
-
231
-
232
-
233
-
234
-
235
-
236
-
237
-
238
-
239
-
240
-
241
-
242
-
243
-
244
-
245
-
246
-
247
-
248
-
249
-
250
-
251
-
252
-
 253
253 -
 254
254 -
 255
255 -
 256
256 -
 257
257 -
 258
258 -
 259
259 -
 260
260 -
 261
261 -
 262
262 -
 263
263 -
264
-
265
-
266
-
267
-
268
-
269
-
270
-
271
-
272
-
273
-
274
-
275
-
276
-
277
-
278
-
279
-
280
-
281
-
282
-
283
-
284
-
285
-
286
-
287
-
288
-
289
-
290
-
291
-
292
-
293
-
294
-
295
-
296
-
297
-
298
-
299
-
300
-
301
-
302
-
303
-
304
-
305
-
306
-
307
-
308
-
309
-
310
-
311
-
312
-
313
-
314
-
315
-
316
-
317
-
318
-
319
-
320
-
321
-
322
-
323
-
324
-
325
-
326
-
327
-
328
-
329
-
330
-
331
-
332
-
333
-
334
-
335
-
336
-
337
-
338
-
339
-
340
-
341
-
342
-
343
-
344
-
345
-
346
-
347
-
348
-
349
-
350
-
351
-
352
-
353
-
354
-
355
-
356
-
357
-
358
-
359
-
360
-
361
-
362
-
363
-
364
-
365
-
366
-
367
-
368
-
369
-
370
-
371
-
372
-
373
-
374
-
375
-
376
-
377
-
378
-
379
-
380
-
381
-
382
-
383
-
384
-
385
-
386
-
387
-
388
-
389
-
390
-
391
-
392
-
393
-
394
-
395
-
396
-
397
-
398
-
399
-
400
-
401
 |
 |
