Casio FC-200V User Guide - Page 53
Entering the CASH Mode, Setting Values, Receipt and Payment Summary - cash flow
 |
UPC - 079767167004
View all Casio FC-200V manuals
Add to My Manuals
Save this manual to your list of manuals |
Page 53 highlights
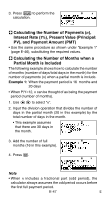
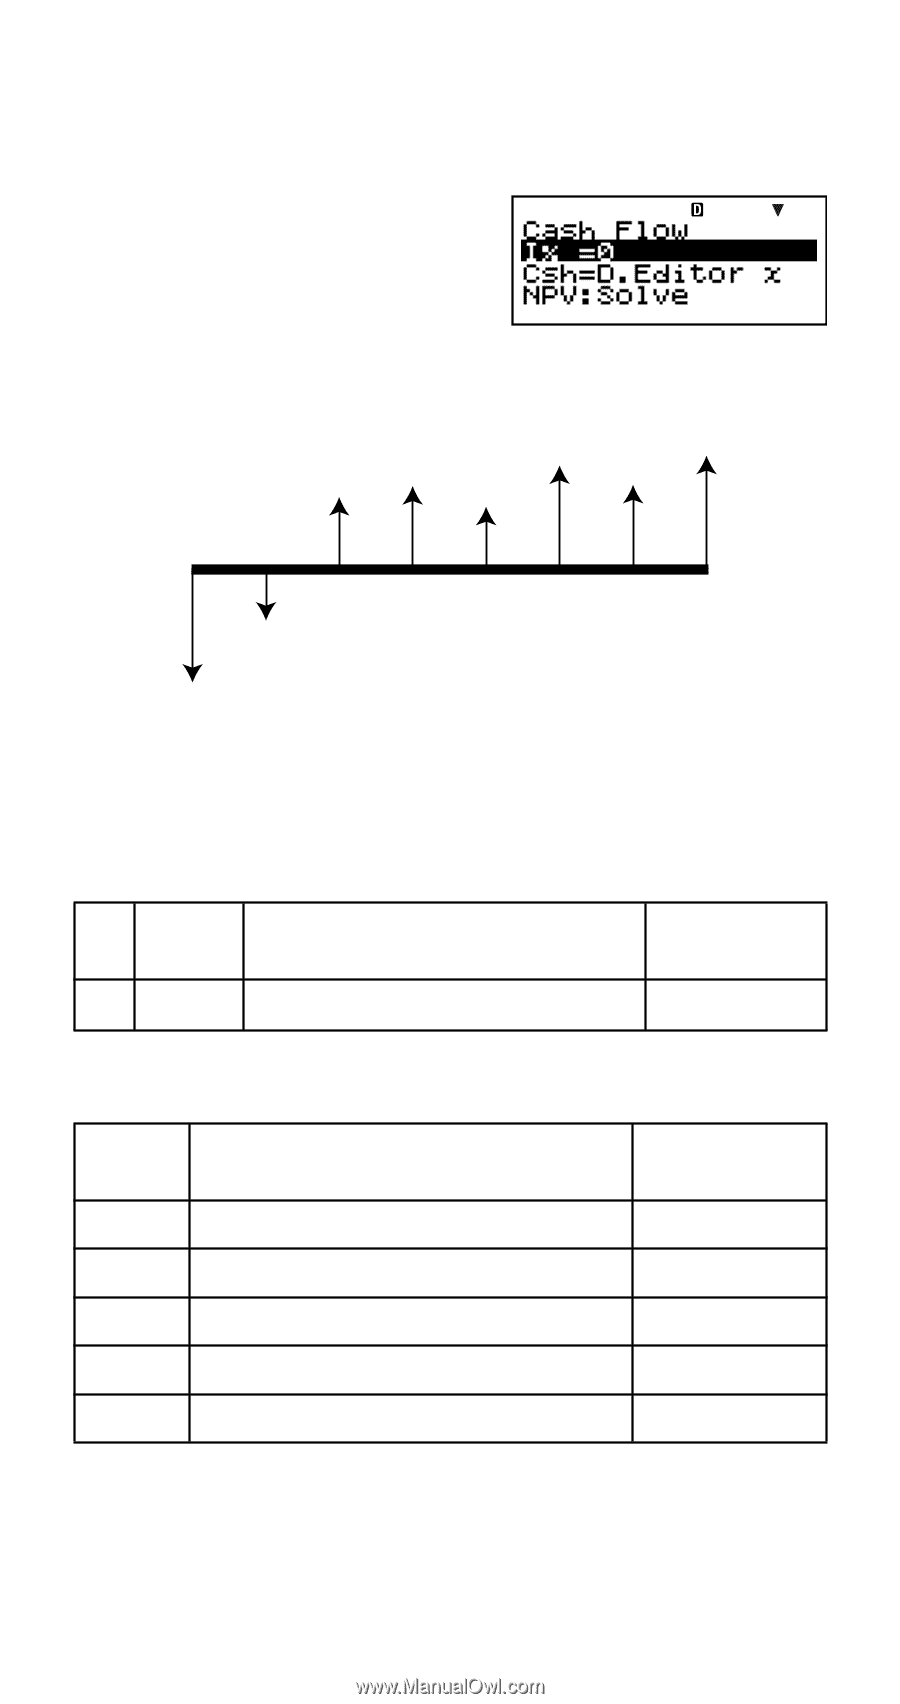
A Entering the CASH Mode • Press C to enter the CASH Mode. Value Input Screen A cash flow diagram like the one shown below helps to visualize the movement of funds. CF2 CF3 CF4 CF5 CF6 CF7 CF1 CF0 With this graph, the initial investment amount is represented by CF0. The cash flow one year later is shown by CF1, two years later by CF2, and so on. A Setting Values No. Display Name 1 I Annual Interest Values Used in Examples 3% A Receipt and Payment Summary Period CF0 CF1 CF2 CF3 CF4 Receipt/Payment Payment Payment Receipt Receipt Receipt Values Used in Examples -$10,000 -$1,000 $4,500 $5,000 $4,000 • Input money paid out as a negative value, using the y key to input the minus sign. E-51
-
 1
1 -
2
-
3
-
4
-
5
-
6
-
7
-
8
-
9
-
10
-
11
-
12
-
13
-
14
-
15
-
16
-
17
-
18
-
19
-
20
-
21
-
22
-
23
-
24
-
25
-
26
-
27
-
28
-
29
-
30
-
31
-
32
-
33
-
34
-
35
-
36
-
37
-
38
-
39
-
40
-
41
-
42
-
43
-
44
-
45
-
46
-
47
-
 48
48 -
 49
49 -
 50
50 -
 51
51 -
 52
52 -
 53
53 -
 54
54 -
 55
55 -
 56
56 -
 57
57 -
 58
58 -
59
-
60
-
61
-
62
-
63
-
64
-
65
-
66
-
67
-
68
-
69
-
70
-
71
-
72
-
73
-
74
-
75
-
76
-
77
-
78
-
79
-
80
-
81
-
82
-
83
-
84
-
85
-
86
-
87
-
88
-
89
-
90
-
91
-
92
-
93
-
94
-
95
-
96
-
97
-
98
-
99
-
100
-
101
-
102
-
103
-
104
-
105
-
106
-
107
-
108
-
109
-
110
-
111
-
112
-
113
-
114
-
115
-
116
-
117
-
118
-
119
-
120
-
121
-
122
-
123
-
124
-
125
-
126
-
127
-
128
-
129
-
130
-
131
-
132
-
133
-
134
-
135
-
136
-
137
-
138
-
139
-
140
-
141
-
142
-
143
-
144
-
145
-
146
-
147
-
148
-
149
 |
 |
E-51
A
Entering the CASH Mode
• Press
C
to enter the CASH Mode.
Value Input Screen
A cash flow diagram like the one shown below helps to
visualize the movement of funds.
With this graph, the initial investment amount is represented
by CF
0
. The cash flow one year later is shown by CF
1
, two
years later by CF
2
, and so on.
A
Setting Values
No.
Display
Name
Values Used
in Examples
1
I
Annual Interest
3%
A
Receipt and Payment Summary
Period
Receipt/Payment
Values Used
in Examples
CF
0
Payment
–$10,000
CF
1
Payment
–$1,000
CF
2
Receipt
$4,500
CF
3
Receipt
$5,000
CF
4
Receipt
$4,000
• Input money paid out as a negative value, using the
y
key to input the minus sign.
CF
0
CF
1
CF
2
CF
3
CF
4
CF
5
CF
6
CF
7