Garmin Edge 840 Owners Manual - Page 28
Viewing Your Real-Time Stamina, Activity Profiles, Data Screens, Stamina, Show Screen
 |
View all Garmin Edge 840 manuals
Add to My Manuals
Save this manual to your list of manuals |
Page 28 highlights
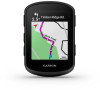
Viewing Your Real-Time Stamina Your device can provide real-time stamina estimates based on your heart rate data and VO2 max. estimate (About VO2 Max. Estimates, page 14). How hard you are working during an activity affects how quickly your stamina drains. Real-time stamina tracking works by combining your physiological metrics with your recent and long-term activity history, such as training duration, distance covered, and training load accumulation (Performance Measurements, page 13). NOTE: For best results, record cycling activities with a power meter consistently for 2 to 3 weeks and with different intensity levels and duration. 1 Select > Activity Profiles. 2 Select a biking profile. 3 Select Data Screens > Stamina. 4 Select Show Screen to view the data screen during your ride. 5 Select Show Current Effort. 6 Select Show Distance or Show Time as the primary data field. 7 Select Layout and Data Fields. 8 Select or to change the layout. 9 Select . 10 Go for a ride (Going for a Ride, page 3). 11 Swipe left or right to view the data screen. Primary stamina data field. You can view the estimated time or distance remaining until you will reach exhaustion at your current effort level. Potential stamina estimate. Think of potential stamina as the total capacity of your fuel tank. It will decrease quickly if you are riding at a high effort level. Reducing your effort or resting results in a slower decline of your potential stamina. Current stamina estimate. Your current stamina reflects how much you have left in the tank at your current level of effort. This estimate combines general fatigue with anaerobic cycling activities, such as sprints, climbs, and attacks. Red: Stamina is depleting. Orange: Stamina is steady. Green: Stamina is recharging. 22 My Stats
-
 1
1 -
2
-
3
-
4
-
5
-
6
-
7
-
8
-
9
-
10
-
11
-
12
-
13
-
14
-
15
-
16
-
17
-
18
-
19
-
20
-
21
-
22
-
 23
23 -
 24
24 -
 25
25 -
 26
26 -
 27
27 -
 28
28 -
 29
29 -
 30
30 -
 31
31 -
 32
32 -
 33
33 -
34
-
35
-
36
-
37
-
38
-
39
-
40
-
41
-
42
-
43
-
44
-
45
-
46
-
47
-
48
-
49
-
50
-
51
-
52
-
53
-
54
-
55
-
56
-
57
-
58
-
59
-
60
-
61
-
62
-
63
-
64
-
65
-
66
-
67
-
68
-
69
-
70
-
71
-
72
-
73
-
74
-
75
-
76
-
77
-
78
-
79
-
80
-
81
-
82
-
83
-
84
-
85
-
86
-
87
-
88
-
89
-
90
-
91
-
92
 |
 |
