Garmin GPSMAP 527 Weather Supplement - Page 11
Surface Winds, Wave Height, Wave Period, and Wave Direction, Wind Barb, Wind Speed, Wind Direc
 |
View all Garmin GPSMAP 527 manuals
Add to My Manuals
Save this manual to your list of manuals |
Page 11 highlights
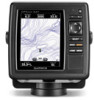
Surface Winds Surface wind vectors appear on the Sea Conditions chart using wind barbs that indicate the direction from which the wind is blowing. A wind barb is a circle with a tail. The line or flag attached to the tail of the wind barb indicates the wind speed. A short line represents 5 knots, a long line represents 10 knots, and triangle represents 50 knots. Wind Barb Wind Speed Wind Direction Calm 5 knots 10 knots 15 knots 20 knots 50 knots 65 knots XM WX Satellite Weather and Cellular Weather Wave Height, Wave Period, and Wave Direction Wave heights for an area appear as variations in color. Different colors indicate different wave heights ➊, as shown in the legend ➋ on the left of the screen. ➋ ➌ ➊ ➍ The wave period indicates the time (in seconds) between successive waves. Wave period lines ➌ indicate areas that have the same wave period. Wave directions appear on the chart using red arrows ➍. The direction of each arrow pointer indicates the direction in which a wave is moving. GPSMAP 400/500 Series Weather Supplement 7
-
 1
1 -
2
-
3
-
4
-
5
-
 6
6 -
 7
7 -
 8
8 -
 9
9 -
 10
10 -
 11
11 -
 12
12 -
 13
13 -
 14
14 -
 15
15 -
 16
16 -
17
-
18
-
19
-
20
-
21
-
22
-
23
-
24
-
25
-
26
-
27
-
28
 |
 |
