Garmin GPSMAP 527 Weather Supplement - Page 9
Forecast Information, Viewing a Marine Forecast or an Offshore Forecast
 |
View all Garmin GPSMAP 527 manuals
Add to My Manuals
Save this manual to your list of manuals |
Page 9 highlights
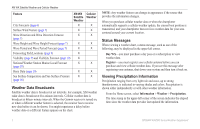
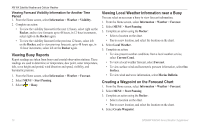
Forecast Information The Forecast chart shows city forecasts, marine forecasts, warnings, hurricane warnings, METARS, county warnings, weather fronts and pressure centers (XM data only), surface pressure, and WX buoys. Viewing Present Forecast Information From the Home screen, select Information > Weather > Forecast. Viewing Forecast Information for Another Time Period NOTE: This feature is available only if you are receiving XM WX Satellite Weather data. It is not available if you are receiving only cellular weather data. 1. From the Home screen, select Information > Weather > Forecast. 2. Complete an action: • To view the weather forecast for the next 12 hours, select right on the Rocker, and to view forecasts up to 48 hours, in 12-hour increments, select right on the Rocker again. • To view the weather forecast for the previous 12 hours, select left on the Rocker, and to view previous forecasts, up to 48 hours ago, in 12hour increments, select left on the Rocker again. Viewing a Marine Forecast or an Offshore Forecast 1. From the Home screen, select Information > Weather > Forecast. 2. Select MENU > Start Panning. 3. Pan the chart to an offshore location. The Marine Forecast or Offshore Forecast options appear when forecast information is available. 4. Select Marine Forecast or Offshore Forecast. GPSMAP 400/500 Series Weather Supplement XM WX Satellite Weather and Cellular Weather Weather Fronts and Pressure Centers: NOTE: This feature is available only if you are receiving XM WX Satellite Weather data. It is not available if you are receiving only cellular weather data. Weather fronts appear as lines that indicate the leading edge of an air mass. Front Symbol Description Cold front Warm front Stationary front Occluded front Trough Pressure-center symbols often appear near weather fronts. Pressure- Description Center Symbol Indicates a low-pressure center, which is a region of relatively lower pressure. Moving away from a low-pressure center results in increased pressure. Winds flow counterclockwise around lowpressure centers in the northern hemispheres. Indicates a high-pressure center, which is a region of relatively higher pressure. Moving away from a high-pressure center results in decreased pressure. Winds flow clockwise around high-pressure centers in the northern hemispheres. 5
-
 1
1 -
2
-
3
-
 4
4 -
 5
5 -
 6
6 -
 7
7 -
 8
8 -
 9
9 -
 10
10 -
 11
11 -
 12
12 -
 13
13 -
 14
14 -
15
-
16
-
17
-
18
-
19
-
20
-
21
-
22
-
23
-
24
-
25
-
26
-
27
-
28
 |
 |
