HP Cisco Nexus 5000 Cisco MDS 9000 Family Release Notes for Cisco MDS SAN-OS R - Page 40

Symptom, Workaround, hardware internal packet-flow dropped, show hardware internal errors

Page 40 highlights

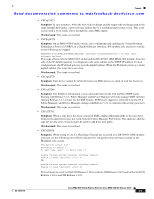
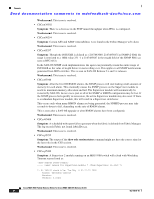
Caveats Send documentation comments to [email protected] • CSCsu56780 Symptom: A Solaris iSCSI host generates this error: iscsi: [ID 498442 kern.warning] WARNING: iscsi session(5) protocol error - received unknown itt:0x0 - protocol error. Workaround:This issue is resolved • CSCsu90793 Symptom: Software failures occurred on a Gigabit Ethernet port when FCIP compression mode auto was used. Workaround: This issue is resolved. • CSCsv24238 Symptom: If you have host to storage connectivity issues, check the following counters to see if you have increasing packet drops throughout the path that these devices traverse. Use the show hardware internal packet-flow dropped command and the show hardware internal errors all command to check the counters. Workaround: This issue is resolved. • CSCsv32082 Symptom: Workaround: This issue is resolved. • CSCsv43094 Symptom: Under rare situations, the MDS 9124 switch might reboot. If you enter the show system exception-info command, the log might show information similar to the following: Time of exception: Fri Oct 24 07:06:30 2008(second=1224803190)CPU register dump:1224803190:00958261 machine check: process feature_mgr (1343), jiffies 0x3d7a6760Free pages in zone[0]:0x6ce1,zone[1]:0x0,zone[2]:0x0Call Trace: [] [] [] [] [] [] [] [] [] [] [

  • 1
  • 2
  • 3
  • 4
  • 5
  • 6
  • 7
  • 8
  • 9
  • 10
  • 11
  • 12
  • 13
  • 14
  • 15
  • 16
  • 17
  • 18
  • 19
  • 20
  • 21
  • 22
  • 23
  • 24
  • 25
  • 26
  • 27
  • 28
  • 29
  • 30
  • 31
  • 32
  • 33
  • 34
  • 35
  • 36
  • 37
  • 38
  • 39
  • 40
  • 41
  • 42
  • 43
  • 44
  • 45
  • 46
  • 47
  • 48
  • 49
  • 50
  • 51
  • 52
  • 53
  • 54
  • 55
  • 56
  • 57
  • 58

Send documentation comments to [email protected]
40
Cisco MDS 9000 Family Release Notes for Cisco MDS SAN-OS Release 3.3(2)
OL-14116-10
Caveats
CSCsu56780
Symptom
: A Solaris iSCSI host generates this error: iscsi: [ID 498442 kern.warning] WARNING:
iscsi session(5) protocol error - received unknown itt:0x0 - protocol error.
Workaround
:This issue is resolved
CSCsu90793
Symptom
: Software failures occurred on a Gigabit Ethernet port when FCIP compression mode
auto was used.
Workaround
: This issue is resolved.
CSCsv24238
Symptom
: If you have host to storage connectivity issues, check the following counters to see if you
have increasing packet drops throughout the path that these devices traverse. Use the
show
hardware internal packet-flow dropped
command and the
show hardware internal errors a
ll
command to check the counters.
Workaround
: This issue is resolved.
CSCsv32082
Symptom
:
Workaround
: This issue is resolved.
CSCsv43094
Symptom
: Under rare situations, the MDS 9124 switch might reboot. If you enter the
show system
exception-info
command, the log might show information similar to the following:
Time of exception: Fri Oct 24 07:06:30 2008(second=1224803190)CPU register
dump:1224803190:00958261 machine check: process feature_mgr (1343), jiffies
0x3d7a6760Free pages in zone[0]:0x6ce1,zone[1]:0x0,zone[2]:0x0Call Trace: [<c0007298>]
[<c0018e44>] [<c000464c>] [<c00041f8>] [<c0055998>] [<c000b474>] [<c0003f48>]
[<10005504>] [<100059fc>] [<0fda00e8>] [<00000000>]
...........
............
Workaround
: This issue is resolved.
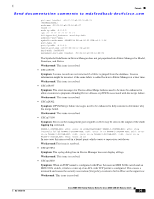
CSCsq12364
Symptom
: You cannot see information about the default access list for the management interface
(mgmt0)which is applied by the system to the management interface (mgmt0)in the absence of any user
access list.
Workaround
:This issue is resolved.
CSCsr40527
Symptom
: An RDL process crashed because of too many fcpings in a loop. This issue might occur
on a switch when fcping is running in a script.
Workaround
: This issue is resolved.
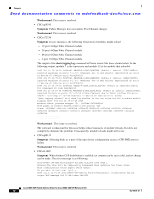
CSCsr49173
Symptom
: A network management application may occasionally detect 100% CPU utilization when
monitoring an MDS switch via SNMP. The
show process cpu
command does not show a high load.
An MDS switch periodically adjusts the hardware clock which can cause the CPU load to reach
100% for less than 1 second. An agent, such as nms, rmon alarm or CLI user, examining the CPU
load at this instant will see false CPU load alarms.
Workaround
: This issue is resolved.