HP DL360 The Intel processor roadmap for industry-standard servers technology - Page 20
Performance comparisons, TPC-C performance
 |
UPC - 613326948835
View all HP DL360 manuals
Add to My Manuals
Save this manual to your list of manuals |
Page 20 highlights
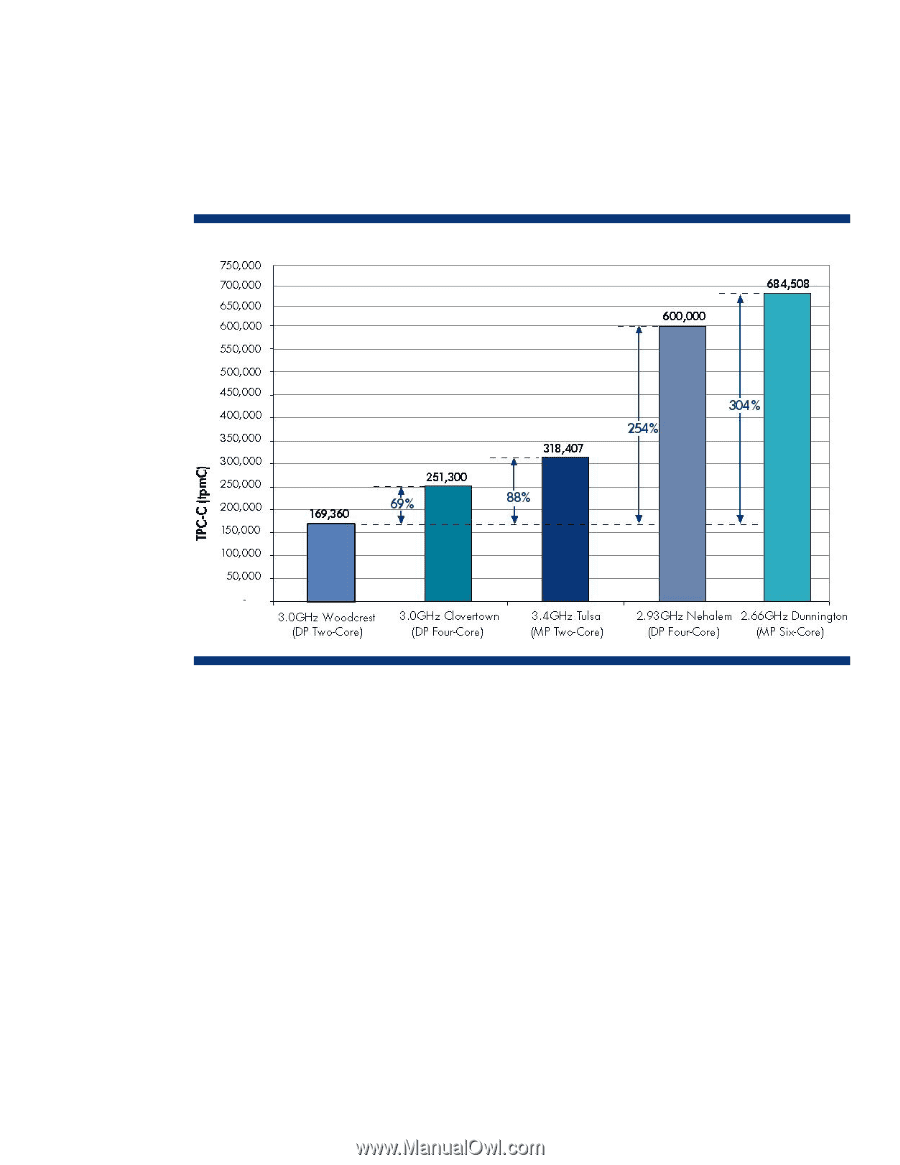
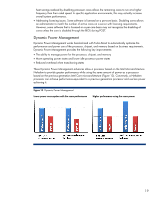
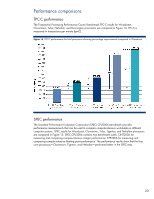
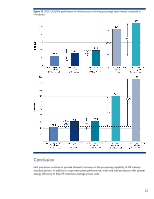
Performance comparisons TPC-C performance The Transaction Processing Performance Council benchmark TPC-C results for Woodcrest, Clovertown, Tulsa, Nehalem, and Dunnington processors are compared in Figure 14. TPC-C is measured in transactions per minute (tpmC). Figure 14. TPC-C performance for Intel processors showing percentage improvements compared to Woodcrest SPEC performance The Standard Performance Evaluation Corporation (SPEC) CPU2006 benchmark provides performance measurements that can be used to compare compute-intensive workloads on different computer systems. SPEC results for Woodcrest, Clovertown, Tulsa, Tigerton, and Nehalem processors are compared in Figure 15. SPEC CPU2006 contains two benchmark suites: CINT2006 for measuring and comparing compute-intensive integer performance; CFP2006 for measuring and comparing compute-intensive floating point performance. The performance results show that the fourcore processors-Clovertown, Tigerton, and Nehalem-performed better in the SPEC tests. 20
-
 1
1 -
2
-
3
-
4
-
5
-
6
-
7
-
8
-
9
-
10
-
11
-
12
-
13
-
14
-
 15
15 -
 16
16 -
 17
17 -
 18
18 -
 19
19 -
 20
20 -
 21
21 -
 22
22
 |
 |