Kyocera FS-3540MFP Teaching Assistant Operation Guide (Setup) - Page 14
Test Scores Chart, Histogram of grades
 |
View all Kyocera FS-3540MFP manuals
Add to My Manuals
Save this manual to your list of manuals |
Page 14 highlights
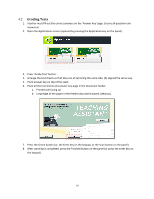
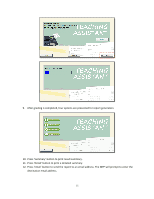
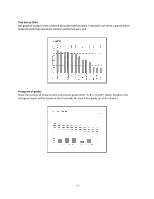
Test Scores Chart Bar-graph of student scores ordered by student performance. Instructors can tell at a glance which students need help and which students performed very well. Histogram of grades Show the number of students who scored each grade letter: A, B, C, D and F. (Note: Grades in the histogram report will be based on the thresholds for each letter grade set at the device.) 14
-
 1
1 -
2
-
3
-
4
-
5
-
6
-
7
-
8
-
 9
9 -
 10
10 -
 11
11 -
 12
12 -
 13
13 -
 14
14 -
 15
15 -
 16
16 -
 17
17 -
 18
18 -
 19
19 -
20
-
21
-
22
-
23
-
24
-
25
-
26
-
27
 |
 |

14
Test Scores Chart
Bar-graph of student scores ordered by student performance. Instructors can tell at a glance which
students need help and which students performed very well.
Histogram of grades
Show the number of students who scored each grade letter: A, B, C, D and F. (Note: Grades in the
histogram report will be based on the thresholds for each letter grade set at the device.)