Canon EOS Rebel SL1 18-55mm IS STM Kit Instruction Manual - Page 272
Highlight Alert, Histogram, Histogram disp, Brightness] Display, RGB] Display
 |
View all Canon EOS Rebel SL1 18-55mm IS STM Kit manuals
Add to My Manuals
Save this manual to your list of manuals |
Page 272 highlights
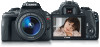
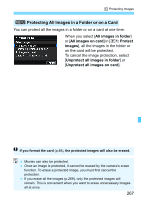
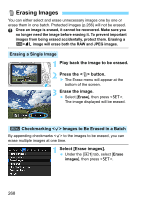
B Shooting Information Display Highlight Alert When the shooting information is displayed, any overexposed areas of the image will blink. To obtain more image detail in the overexposed areas, set the exposure compensation to a negative amount and shoot again. Histogram The brightness histogram shows the exposure level distribution and overall brightness. The RGB histogram is for checking the color saturation and gradation. The display can be switched with [x2: Histogram disp]. [Brightness] Display Sample Histograms This histogram is a graph showing the distribution of the image's brightness level. The horizontal axis indicates the brightness level (darker on the left and brighter on the right), while the vertical axis indicates Dark image how many pixels exist for each brightness level. The more pixels there are toward the left, the darker the image. The more pixels there are toward the right, the brighter the image. If there are too many pixels on Normal brightness the left, the shadow detail will be lost. If there are too many pixels on the right, the highlight detail will be lost. The gradation in-between will be reproduced. By Bright image checking the image and its brightness histogram, you can see the exposure level inclination and the overall gradation. [RGB] Display This histogram is a graph showing the distribution of each primary color's brightness level in the image (RGB or red, green, and blue). The horizontal axis indicates the color's brightness level (darker on the left and brighter on the right), while the vertical axis indicates how many pixels exist for each color brightness level. The more pixels there are toward the left, the darker and less prominent the color. The more pixels there are toward the right, the brighter and denser the color. If there are too many pixels on the left, the respective color information will be lacking. If there are too many pixels on the right, the color will be too saturated with no gradation. By checking the image's RGB histogram, you can see the color's saturation and gradation condition, as well as white balance inclination. 272
-
 1
1 -
2
-
3
-
4
-
5
-
6
-
7
-
8
-
9
-
10
-
11
-
12
-
13
-
14
-
15
-
16
-
17
-
18
-
19
-
20
-
21
-
22
-
23
-
24
-
25
-
26
-
27
-
28
-
29
-
30
-
31
-
32
-
33
-
34
-
35
-
36
-
37
-
38
-
39
-
40
-
41
-
42
-
43
-
44
-
45
-
46
-
47
-
48
-
49
-
50
-
51
-
52
-
53
-
54
-
55
-
56
-
57
-
58
-
59
-
60
-
61
-
62
-
63
-
64
-
65
-
66
-
67
-
68
-
69
-
70
-
71
-
72
-
73
-
74
-
75
-
76
-
77
-
78
-
79
-
80
-
81
-
82
-
83
-
84
-
85
-
86
-
87
-
88
-
89
-
90
-
91
-
92
-
93
-
94
-
95
-
96
-
97
-
98
-
99
-
100
-
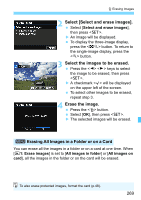
101
-
102
-
103
-
104
-
105
-
106
-
107
-
108
-
109
-
110
-
111
-
112
-
113
-
114
-
115
-
116
-
117
-
118
-
119
-
120
-
121
-
122
-
123
-
124
-
125
-
126
-
127
-
128
-
129
-
130
-
131
-
132
-
133
-
134
-
135
-
136
-
137
-
138
-
139
-
140
-
141
-
142
-
143
-
144
-
145
-
146
-
147
-
148
-
149
-
150
-
151
-
152
-
153
-
154
-
155
-
156
-
157
-
158
-
159
-
160
-
161
-
162
-
163
-
164
-
165
-
166
-
167
-
168
-
169
-
170
-
171
-
172
-
173
-
174
-
175
-
176
-
177
-
178
-
179
-
180
-
181
-
182
-
183
-
184
-
185
-
186
-
187
-
188
-
189
-
190
-
191
-
192
-
193
-
194
-
195
-
196
-
197
-
198
-
199
-
200
-
201
-
202
-
203
-
204
-
205
-
206
-
207
-
208
-
209
-
210
-
211
-
212
-
213
-
214
-
215
-
216
-
217
-
218
-
219
-
220
-
221
-
222
-
223
-
224
-
225
-
226
-
227
-
228
-
229
-
230
-
231
-
232
-
233
-
234
-
235
-
236
-
237
-
238
-
239
-
240
-
241
-
242
-
243
-
244
-
245
-
246
-
247
-
248
-
249
-
250
-
251
-
252
-
253
-
254
-
255
-
256
-
257
-
258
-
259
-
260
-
261
-
262
-
263
-
264
-
265
-
266
-
 267
267 -
 268
268 -
 269
269 -
 270
270 -
 271
271 -
 272
272 -
 273
273 -
 274
274 -
 275
275 -
 276
276 -
 277
277 -
278
-
279
-
280
-
281
-
282
-
283
-
284
-
285
-
286
-
287
-
288
-
289
-
290
-
291
-
292
-
293
-
294
-
295
-
296
-
297
-
298
-
299
-
300
-
301
-
302
-
303
-
304
-
305
-
306
-
307
-
308
-
309
-
310
-
311
-
312
-
313
-
314
-
315
-
316
-
317
-
318
-
319
-
320
-
321
-
322
-
323
-
324
-
325
-
326
-
327
-
328
-
329
-
330
-
331
-
332
-
333
-
334
-
335
-
336
-
337
-
338
-
339
-
340
-
341
-
342
-
343
-
344
-
345
-
346
-
347
-
348
-
349
-
350
-
351
-
352
-
353
-
354
-
355
-
356
-
357
-
358
-
359
-
360
-
361
-
362
-
363
-
364
-
365
-
366
-
367
-
368
-
369
-
370
-
371
-
372
-
373
-
374
-
375
-
376
-
377
-
378
-
379
-
380
-
381
-
382
-
383
-
384
-
385
-
386
-
387
-
388
 |
 |