D-Link DMS-3130-30TS Product Manual - Page 41
Web User Interface (Web UI), Areas of the Web UI
 |
View all D-Link DMS-3130-30TS manuals
Add to My Manuals
Save this manual to your list of manuals |
Page 41 highlights
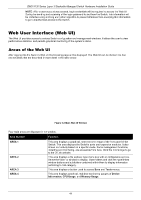
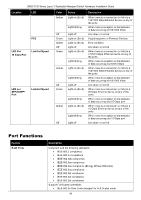
DMS-3130 Series Layer 3 Stackable Managed Switch Hardware Installation Guide NOTE: After a user account was created, login credentials will be required to access the Web UI. During the sending and receiving of the login password to and from the Switch, this information will be protected using a strong encryption algorithm to prevent attackers from snooping this information to gain unauthorized access to the Switch. Web User Interface (Web UI) The Web UI provides access to various Switch configuration and management windows. It allows the user to view performance statistics, and permits graphical monitoring of the system's status. Areas of the Web UI After logging into the Switch's Web UI, the following page will be displayed. The Web UI can be divided into four distinct areas that are described in more detail in the table below. Area 3 Area 1 Area 2 Area 4 Figure 0-2 Main Web UI Window Four main areas are displayed in the window. Area Number Function AREA 1 AREA 2 AREA 3 AREA 4 This area displays a graphical, near real-time image of the front panel of the Switch. This area displays the Switch's ports and expansion modules. It also shows port activity based on a specific mode. Some management functions, including port monitoring, are accessible from here. Click the D-Link logo to go to the D-Link website. This area displays a file explorer-type menu tree with all configurable options. Select the folder or window to display. Open folders and click the hyperlinked window buttons and subfolders contained within them to display information pertaining to that category. This area displays a toolbar used to access Save and Tools menus. This area displays graphical, real-time monitoring gauges of Device Information, CPU Usage, and Memory Usage. 41
-
 1
1 -
2
-
3
-
4
-
5
-
6
-
7
-
8
-
9
-
10
-
11
-
12
-
13
-
14
-
15
-
16
-
17
-
18
-
19
-
20
-
21
-
22
-
23
-
24
-
25
-
26
-
27
-
28
-
29
-
30
-
31
-
32
-
33
-
34
-
35
-
 36
36 -
 37
37 -
 38
38 -
 39
39 -
 40
40 -
 41
41 -
 42
42 -
 43
43 -
 44
44 -
 45
45 -
 46
46 -
47
-
48
-
49
-
50
-
51
-
52
 |
 |
