Dell PowerConnect W-Airwave W-Airwave 7.3 User Guide - Page 124
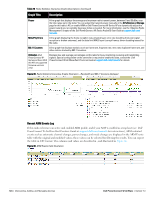
Recent ARM Events Log
 |
View all Dell PowerConnect W-Airwave manuals
Add to My Manuals
Save this manual to your list of manuals |
Page 124 highlights
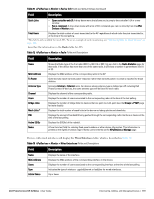
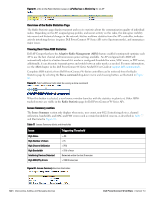
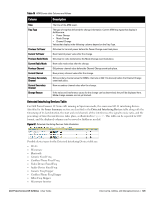
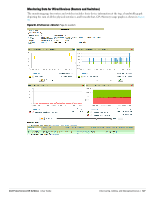
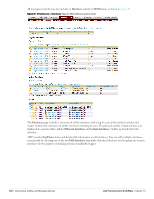
Table 78 Radio Statistics Interactive Graphs Descriptions (Continued) Graph Title Description Power A line graph that displays the average and maximum radio transmit power, between 0 and 30 dBm, over the time range set in the slider. You can adjust the transmit power manually in the APs/Devices > Manage page for this radio's AP, or enable ARM on Dell PowerConnect W-Series APs to dynamically adjust the power toward your acceptable Coverage Index as needed. For more information, see the "Adaptive Radio Management" chapter of the Dell PowerConnect W-Series ArubaOS User Guide at support.dell.com/ manuals . MAC/Phy Errors A line graph displaying the frame reception rate, physical layer error rate (resulting from poor signal reception or broken antennas), and the data link (MAC) layer (corrupt frames, driver decoding issues) for the radio. 802.11 Counters A line graph that displays statistics such as frame rate, fragment rate, retry rate, duplicate frame rate, and other metrics tracked by 802.11 counters. Utilization (Dell PowerConnect WSeries and Cisco WLC thin APs on supported firmware versions only) Displays max and average percentages on this radio for busy, interfering receiving and transmitting signals. Special configuration on the controller is required to enable this data; consult the Dell PowerConnect W-AirWave Best Practices Guide at support.dell.com/manuals for details. Figure 85 Radio Statistics Interactive Graphs Illustration - Bandwidth and 802.11 Counters displayed Recent ARM Events Log If this radio references an active and enabled ARM profile, and if your AMP is enabled as a trap host (see Dell PowerConnect W-AirWave Best Practices Guide at support.dell.com/manuals for instructions), ARM-initiated events such as automatic channel changes, power changes, and mode changes are displayed in the ARM Events table with the original and modified values; these values can be selected for filtering the results. You can export the table in CSV format. The columns and values are described in , and illustrated in Figure 86. Figure 86 ARM Events Table Illustration 124 | Discovering, Adding, and Managing Devices Dell PowerConnect W-AirWave | Version 7.3
-
 1
1 -
2
-
3
-
4
-
5
-
6
-
7
-
8
-
9
-
10
-
11
-
12
-
13
-
14
-
15
-
16
-
17
-
18
-
19
-
20
-
21
-
22
-
23
-
24
-
25
-
26
-
27
-
28
-
29
-
30
-
31
-
32
-
33
-
34
-
35
-
36
-
37
-
38
-
39
-
40
-
41
-
42
-
43
-
44
-
45
-
46
-
47
-
48
-
49
-
50
-
51
-
52
-
53
-
54
-
55
-
56
-
57
-
58
-
59
-
60
-
61
-
62
-
63
-
64
-
65
-
66
-
67
-
68
-
69
-
70
-
71
-
72
-
73
-
74
-
75
-
76
-
77
-
78
-
79
-
80
-
81
-
82
-
83
-
84
-
85
-
86
-
87
-
88
-
89
-
90
-
91
-
92
-
93
-
94
-
95
-
96
-
97
-
98
-
99
-
100
-
101
-
102
-
103
-
104
-
105
-
106
-
107
-
108
-
109
-
110
-
111
-
112
-
113
-
114
-
115
-
116
-
117
-
118
-
 119
119 -
 120
120 -
 121
121 -
 122
122 -
 123
123 -
 124
124 -
 125
125 -
 126
126 -
 127
127 -
 128
128 -
 129
129 -
130
-
131
-
132
-
133
-
134
-
135
-
136
-
137
-
138
-
139
-
140
-
141
-
142
-
143
-
144
-
145
-
146
-
147
-
148
-
149
-
150
-
151
-
152
-
153
-
154
-
155
-
156
-
157
-
158
-
159
-
160
-
161
-
162
-
163
-
164
-
165
-
166
-
167
-
168
-
169
-
170
-
171
-
172
-
173
-
174
-
175
-
176
-
177
-
178
-
179
-
180
-
181
-
182
-
183
-
184
-
185
-
186
-
187
-
188
-
189
-
190
-
191
-
192
-
193
-
194
-
195
-
196
-
197
-
198
-
199
-
200
-
201
-
202
-
203
-
204
-
205
-
206
-
207
-
208
-
209
-
210
-
211
-
212
-
213
-
214
-
215
-
216
-
217
-
218
-
219
-
220
-
221
-
222
-
223
-
224
-
225
-
226
-
227
-
228
-
229
-
230
-
231
-
232
-
233
-
234
-
235
-
236
-
237
-
238
-
239
-
240
-
241
-
242
-
243
-
244
-
245
-
246
-
247
-
248
-
249
-
250
-
251
-
252
-
253
-
254
-
255
-
256
-
257
-
258
-
259
-
260
-
261
-
262
-
263
-
264
-
265
-
266
-
267
-
268
-
269
-
270
-
271
-
272
-
273
-
274
-
275
-
276
-
277
-
278
-
279
-
280
-
281
-
282
-
283
-
284
-
285
-
286
-
287
-
288
-
289
-
290
-
291
-
292
-
293
-
294
-
295
-
296
-
297
-
298
-
299
-
300
-
301
-
302
-
303
-
304
-
305
-
306
-
307
-
308
 |
 |