MSI Z370-A PRO User Manual - Page 80
Intel® Extreme Tuning Utility, Views Settings Help
 |
View all MSI Z370-A PRO manuals
Add to My Manuals
Save this manual to your list of manuals |
Page 80 highlights
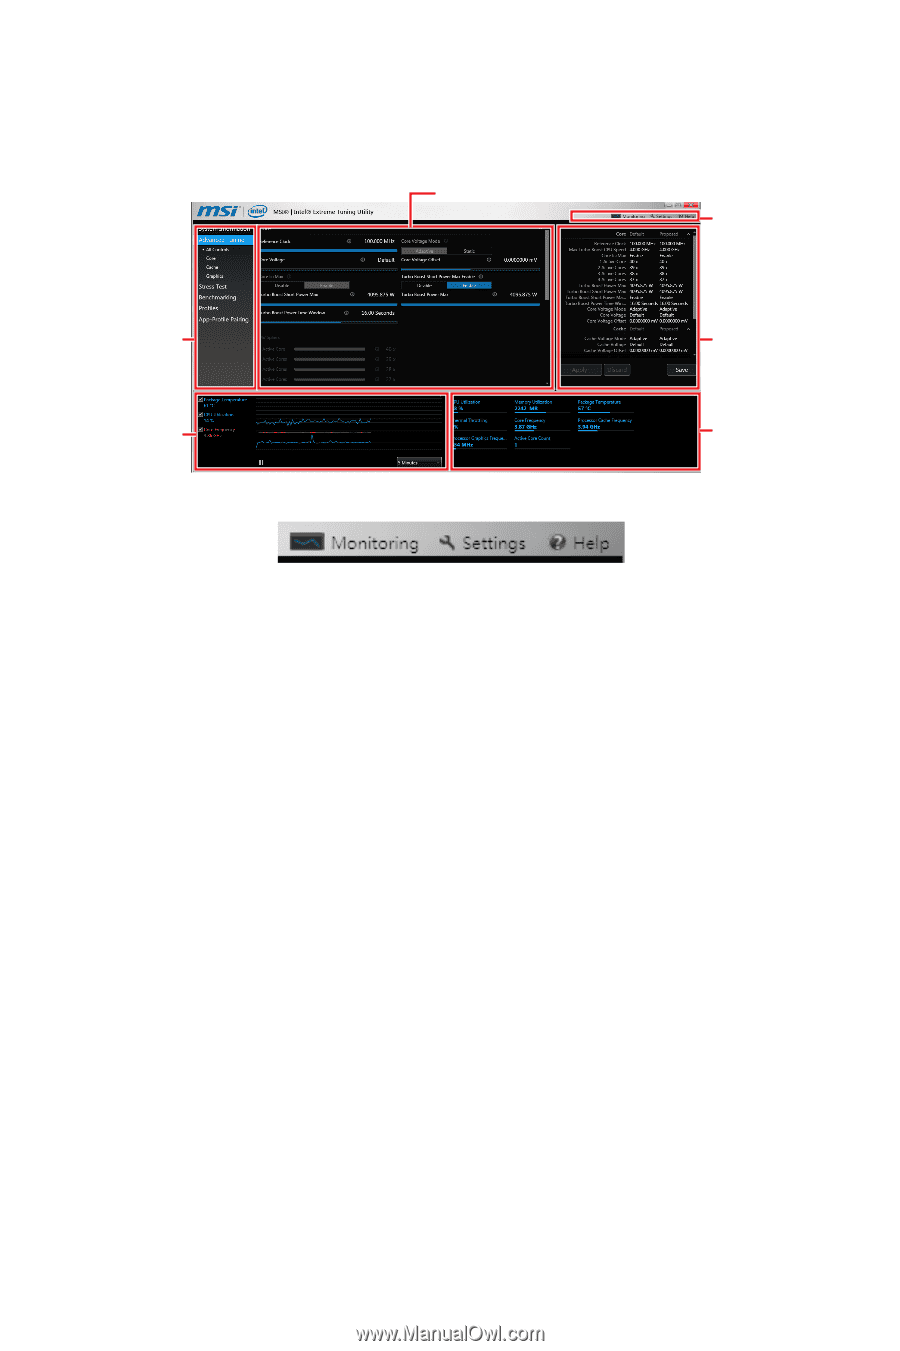
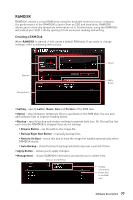
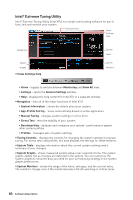
Intel® Extreme Tuning Utility Intel® Extreme Tuning Utility (Intel XTU) is a simple overclocking software for you to tune, test and monitor your system. Tuning Controls Views Settings Help Navigation System Graphs y Views Settings Help System Table System Monitors ƒ Views - toggles to switche between Monitoring and Show All view. ƒ Settings - opens the General Settings window. ƒ Help - displays the help content for Intel XTU in a separate window. y Navigation - lists all of the major functions of Intel XTU. ƒ System Information - shows the details about your system. ƒ App-Profile Pairing - tunes automatically based on active application. ƒ Manual Tuning - changes system settings in a free form. ƒ Stress Test - tests the stability of your system. ƒ Benchmarking - analyzes and compares your system's performance against other system profiles. ƒ Profiles - manages sets of system settings. y Tuning Controls - displays the controls for changing the system settings in manual tuning. For stress tests and profiles, this area displays the settings for these features. y System Table - displays information about the current system settings and a summary of your changes. y System Graphs - shows measured system values over a period of time. The system graphs update live as changes are detected in the system. You can customize the system graphs to show the data you need for your overclocking strategy in the system graphs preferences. y System Monitors - shows the range of the value, averages, and the current value. The monitors change color if the monitored values fall into warning or critical zones. 80 Software Description
-
 1
1 -
2
-
3
-
4
-
5
-
6
-
7
-
8
-
9
-
10
-
11
-
12
-
13
-
14
-
15
-
16
-
17
-
18
-
19
-
20
-
21
-
22
-
23
-
24
-
25
-
26
-
27
-
28
-
29
-
30
-
31
-
32
-
33
-
34
-
35
-
36
-
37
-
38
-
39
-
40
-
41
-
42
-
43
-
44
-
45
-
46
-
47
-
48
-
49
-
50
-
51
-
52
-
53
-
54
-
55
-
56
-
57
-
58
-
59
-
60
-
61
-
62
-
63
-
64
-
65
-
66
-
67
-
68
-
69
-
70
-
71
-
72
-
73
-
74
-
 75
75 -
 76
76 -
 77
77 -
 78
78 -
 79
79 -
 80
80 -
 81
81 -
 82
82 -
 83
83 -
 84
84 -
 85
85 -
86
-
87
-
88
-
89
-
90
-
91
-
92
-
93
-
94
-
95
 |
 |