McAfee TEECDE-AA-AA Evaluator Guide - Page 39
Using Dashboards and Queries
 |
View all McAfee TEECDE-AA-AA manuals
Add to My Manuals
Save this manual to your list of manuals |
Page 39 highlights
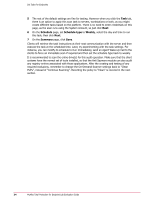
Using Dashboards and Queries Dashboards and queries provide various types of status information about your environment. Each product in the Total Protection for Endpoint suite has predefined queries. The suite includes several predefined dashboards. You can also create custom dashboards and queries. By default, the only active dashboard after installation is the ePO Summary dashboard. In this section, you will activate a second dashboard, change one of the monitors, run a predefined query, and create a custom query. Activating a dashboard To make a dashboard part of your active set on the tab bar of the Dashboards page, you need to activate it. 1 Click Menu | Reporting | Dashboards. 2 From the Options drop-down list, select Manage Dashboards. The Manage Dashboards page appears. 3 From the Dashboards list, highlight HIP Dashboard, then click Make Active. 4 When prompted, click OK, then click Close. The HIP Dashboard now appears on the tab bar. Take a moment to examine this dashboard and the information it provides. Changing a dashboard monitor Most default dashboards contain six monitors. If the default monitors do not give you the information you want, you can change the set of monitors rather than create a new dashboard. To view some information about VirusScan Enterprise and Potentially Unwanted Programs, you will duplicate, then modify the VSE: Current Detections dashboard. 1 Click Menu | Reporting | Dashboards. 2 From the Options drop-down list, select Manage Dashboards. The Manage Dashboards page appears. 3 From the Dashboards list, highlight VSE: Current Detections then click Duplicate. 4 For Name, type VSE: Detections (custom), and click OK. 5 Click Edit. 6 Find the monitor named VSE: Threats Detected in the Last 24 Hours and click Remove. 7 Click New Monitor. 8 From the Category list, select Queries. 9 From the Monitor list, select VSE: DAT Deployment, then click OK. 10 Find the monitor named VSE: Threats Detected in the Last 7 Days and click Remove. 11 Click New Monitor. 12 From the Category list, select Queries. McAfee Total Protection for Endpoint Lab Evaluation Guide 39
-
 1
1 -
2
-
3
-
4
-
5
-
6
-
7
-
8
-
9
-
10
-
11
-
12
-
13
-
14
-
15
-
16
-
17
-
18
-
19
-
20
-
21
-
22
-
23
-
24
-
25
-
26
-
27
-
28
-
29
-
30
-
31
-
32
-
33
-
 34
34 -
 35
35 -
 36
36 -
 37
37 -
 38
38 -
 39
39 -
 40
40 -
 41
41 -
 42
42 -
 43
43 -
 44
44
 |
 |
