Netgear DGND3700v1 [English]: DGND3700 User Manual (PDF) - Page 71
Show Statistics Button, ADSL Link Downstream or Upstream
 |
View all Netgear DGND3700v1 manuals
Add to My Manuals
Save this manual to your list of manuals |
Page 71 highlights
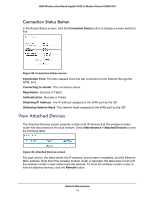
N600 Wireless Dual Band Gigabit ADSL2+ Modem Router DGND3700 Show Statistics Button Click the Show Statistics button on the Router Status screen to display a screen similar to this: Figure 37. Router statistics screen • Port. The statistics for the WAN (Internet), LAN (local), and wireless LAN (WLAN) ports. For each port, the screen displays the following: - Status. The link status of the port. - TxPkts. The number of packets transmitted since reset or manual clear. - RxPkts. The number of packets received since reset or manual clear. - Collisions. The number of collisions since reset or manual clear. - Tx B/s. The current line utilization-percentage of current bandwidth used. - Rx B/s. The average line utilization. - Up Time. The time elapsed since the last power cycle or reset. • ADSL Link Downstream or Upstream. The statistics for the upstream and downstream ADSL link. These statistics are of interest to your technical support representative if you have problems obtaining or maintaining a connection. • Connection Speed. Typically, the downstream speed is faster than the upstream speed. • Line Attenuation. The line attenuation increases the farther you are physically located from your ISP's facilities. • Noise Margin. The signal-to-noise ratio, which is a measure of the quality of the signal on the line. • Poll Interval. The interval at which the statistics are updated in this window. Click the Stop button to freeze the display. Network Maintenance 71
-
 1
1 -
2
-
3
-
4
-
5
-
6
-
7
-
8
-
9
-
10
-
11
-
12
-
13
-
14
-
15
-
16
-
17
-
18
-
19
-
20
-
21
-
22
-
23
-
24
-
25
-
26
-
27
-
28
-
29
-
30
-
31
-
32
-
33
-
34
-
35
-
36
-
37
-
38
-
39
-
40
-
41
-
42
-
43
-
44
-
45
-
46
-
47
-
48
-
49
-
50
-
51
-
52
-
53
-
54
-
55
-
56
-
57
-
58
-
59
-
60
-
61
-
62
-
63
-
64
-
65
-
 66
66 -
 67
67 -
 68
68 -
 69
69 -
 70
70 -
 71
71 -
 72
72 -
 73
73 -
 74
74 -
 75
75 -
 76
76 -
77
-
78
-
79
-
80
-
81
-
82
-
83
-
84
-
85
-
86
-
87
-
88
-
89
-
90
-
91
-
92
-
93
-
94
-
95
-
96
-
97
-
98
-
99
-
100
-
101
-
102
-
103
-
104
-
105
-
106
-
107
-
108
-
109
-
110
-
111
-
112
-
113
-
114
-
115
-
116
-
117
-
118
-
119
-
120
-
121
-
122
-
123
-
124
-
125
-
126
-
127
-
128
-
129
-
130
-
131
-
132
-
133
-
134
-
135
-
136
-
137
-
138
-
139
-
140
-
141
-
142
-
143
-
144
-
145
-
146
-
147
-
148
-
149
-
150
-
151
-
152
-
153
-
154
-
155
-
156
-
157
-
158
-
159
-
160
-
161
-
162
-
163
-
164
-
165
-
166
-
167
-
168
-
169
-
170
-
171
-
172
-
173
-
174
-
175
-
176
-
177
-
178
-
179
-
180
-
181
-
182
-
183
-
184
-
185
 |
 |
