TP-Link T1500G-10PS T1500G-10PSUN V1 User Guide - Page 27
Device Description
 |
View all TP-Link T1500G-10PS manuals
Add to My Manuals
Save this manual to your list of manuals |
Page 27 highlights
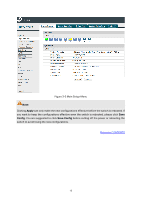
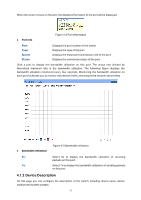
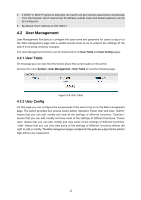
When the cursor moves on the port, the detailed information of the port will be displayed. Port Info Figure 4-2 Port Information Port: Type: Speed: Status: Displays the port number of the switch. Displays the type of the port. Displays the maximum transmission rate of the port. Displays the connection status of the port. Click a port to display the bandwidth utilization on this port. The actual rate divided by theoretical maximum rate is the bandwidth utilization. The following figure displays the bandwidth utilization monitored every four seconds. Monitoring the bandwidth utilization on each port facilitates you to monitor the network traffic and analyze the network abnormities. Bandwidth Utilization Figure 4-3 Bandwidth Utilization Rx: Select Rx to display the bandwidth utilization of receiving packets on this port. Tx: Select Tx to display the bandwidth utilization of sending packets on this port. 4.1.2 Device Description On this page you can configure the description of the switch, including device name, device location and system contact. 17
-
 1
1 -
2
-
3
-
4
-
5
-
6
-
7
-
8
-
9
-
10
-
11
-
12
-
13
-
14
-
15
-
16
-
17
-
18
-
19
-
20
-
21
-
 22
22 -
 23
23 -
 24
24 -
 25
25 -
 26
26 -
 27
27 -
 28
28 -
 29
29 -
 30
30 -
 31
31 -
 32
32 -
33
-
34
-
35
-
36
-
37
-
38
-
39
-
40
-
41
-
42
-
43
-
44
-
45
-
46
-
47
-
48
-
49
-
50
-
51
-
52
-
53
-
54
-
55
-
56
-
57
-
58
-
59
-
60
-
61
-
62
-
63
-
64
-
65
-
66
-
67
-
68
-
69
-
70
-
71
-
72
-
73
-
74
-
75
-
76
-
77
-
78
-
79
-
80
-
81
-
82
-
83
-
84
-
85
-
86
-
87
-
88
-
89
-
90
-
91
-
92
-
93
-
94
-
95
-
96
-
97
-
98
-
99
-
100
-
101
-
102
-
103
-
104
-
105
-
106
-
107
-
108
-
109
-
110
-
111
-
112
-
113
-
114
-
115
-
116
-
117
-
118
-
119
-
120
-
121
-
122
-
123
-
124
-
125
-
126
-
127
-
128
-
129
-
130
-
131
-
132
-
133
-
134
-
135
-
136
-
137
-
138
-
139
-
140
-
141
-
142
-
143
-
144
-
145
-
146
-
147
-
148
-
149
-
150
-
151
-
152
-
153
-
154
-
155
-
156
-
157
-
158
-
159
-
160
-
161
-
162
-
163
-
164
-
165
-
166
-
167
-
168
-
169
-
170
-
171
-
172
-
173
-
174
-
175
-
176
-
177
-
178
-
179
-
180
-
181
-
182
-
183
-
184
-
185
-
186
-
187
-
188
-
189
-
190
-
191
-
192
-
193
-
194
-
195
-
196
-
197
-
198
-
199
-
200
-
201
-
202
-
203
-
204
-
205
-
206
-
207
-
208
-
209
-
210
-
211
-
212
-
213
-
214
-
215
-
216
-
217
-
218
-
219
-
220
-
221
-
222
-
223
-
224
-
225
-
226
-
227
-
228
-
229
-
230
-
231
-
232
-
233
-
234
-
235
-
236
-
237
-
238
-
239
-
240
-
241
-
242
 |
 |
