TP-Link T1500G-10PS T1500G-10PSUN V1 User Guide - Page 63

Traffic Statistics

Page 63 highlights

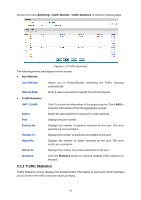
Choose the menu Switching→Traffic Monitor→Traffic Summary to load the following page. Figure 5-12 Traffic Summary The following entries are displayed on this screen:  Auto Refresh Auto Refresh: Refresh Rate: Allows you to Enable/Disable refreshing the Traffic Summary automatically. Enter a value in seconds to specify the refresh interval.  Traffic Summary UNIT:1/LAGS: Select: Port: Packets Rx: Packets Tx: Octets Rx: Octets Tx: Statistics: Click 1 to show the information of the physical ports. Click LAGS to show the information of the link aggregation groups Select the desired port for clearing. It is multi-optional. Displays the port number. Displays the number of packets received on the port. The error packets are not counted in. Displays the number of packets transmitted on the port. Displays the number of octets received on the port. The error octets are counted in. Displays the number of octets transmitted on the port. Click the Statistics button to view the detailed traffic statistics of the port. 5.3.2 Traffic Statistics Traffic Statistics screen displays the detailed traffic information of each port, which facilitates you to monitor the traffic and locate faults promptly. 53

  • 1
  • 2
  • 3
  • 4
  • 5
  • 6
  • 7
  • 8
  • 9
  • 10
  • 11
  • 12
  • 13
  • 14
  • 15
  • 16
  • 17
  • 18
  • 19
  • 20
  • 21
  • 22
  • 23
  • 24
  • 25
  • 26
  • 27
  • 28
  • 29
  • 30
  • 31
  • 32
  • 33
  • 34
  • 35
  • 36
  • 37
  • 38
  • 39
  • 40
  • 41
  • 42
  • 43
  • 44
  • 45
  • 46
  • 47
  • 48
  • 49
  • 50
  • 51
  • 52
  • 53
  • 54
  • 55
  • 56
  • 57
  • 58
  • 59
  • 60
  • 61
  • 62
  • 63
  • 64
  • 65
  • 66
  • 67
  • 68
  • 69
  • 70
  • 71
  • 72
  • 73
  • 74
  • 75
  • 76
  • 77
  • 78
  • 79
  • 80
  • 81
  • 82
  • 83
  • 84
  • 85
  • 86
  • 87
  • 88
  • 89
  • 90
  • 91
  • 92
  • 93
  • 94
  • 95
  • 96
  • 97
  • 98
  • 99
  • 100
  • 101
  • 102
  • 103
  • 104
  • 105
  • 106
  • 107
  • 108
  • 109
  • 110
  • 111
  • 112
  • 113
  • 114
  • 115
  • 116
  • 117
  • 118
  • 119
  • 120
  • 121
  • 122
  • 123
  • 124
  • 125
  • 126
  • 127
  • 128
  • 129
  • 130
  • 131
  • 132
  • 133
  • 134
  • 135
  • 136
  • 137
  • 138
  • 139
  • 140
  • 141
  • 142
  • 143
  • 144
  • 145
  • 146
  • 147
  • 148
  • 149
  • 150
  • 151
  • 152
  • 153
  • 154
  • 155
  • 156
  • 157
  • 158
  • 159
  • 160
  • 161
  • 162
  • 163
  • 164
  • 165
  • 166
  • 167
  • 168
  • 169
  • 170
  • 171
  • 172
  • 173
  • 174
  • 175
  • 176
  • 177
  • 178
  • 179
  • 180
  • 181
  • 182
  • 183
  • 184
  • 185
  • 186
  • 187
  • 188
  • 189
  • 190
  • 191
  • 192
  • 193
  • 194
  • 195
  • 196
  • 197
  • 198
  • 199
  • 200
  • 201
  • 202
  • 203
  • 204
  • 205
  • 206
  • 207
  • 208
  • 209
  • 210
  • 211
  • 212
  • 213
  • 214
  • 215
  • 216
  • 217
  • 218
  • 219
  • 220
  • 221
  • 222
  • 223
  • 224
  • 225
  • 226
  • 227
  • 228
  • 229
  • 230
  • 231
  • 232
  • 233
  • 234
  • 235
  • 236
  • 237
  • 238
  • 239
  • 240
  • 241
  • 242

Choose the menu
Switching
Traffic Monitor
→Traffic Summary
to load the following page.
Figure 5-12 Traffic Summary
The following entries are displayed on this screen:
Auto Refresh
Auto Refresh:
Allows you to Enable/Disable refreshing the Traffic Summary
automatically.
Refresh Rate:
Enter a value in seconds to specify the refresh interval.
Traffic Summary
UNIT:1/LAGS:
Click
1
to show the information of the physical ports. Click
LAGS
to
show the information of the link aggregation groups
Select:
Select the desired port for clearing. It is multi-optional.
Port:
Displays the port number.
Packets Rx:
Displays the number of packets received on the port. The error
packets are not counted in.
Packets Tx:
Displays the number of packets transmitted on the port.
Octets Rx:
Displays the number of octets received on the port. The error
octets are counted in.
Octets Tx:
Displays the number of octets transmitted on the port.
Statistics:
Click the
Statistics
button to view the detailed traffic statistics of
the port.
5.3.2
Traffic Statistics
Traffic Statistics screen displays the detailed traffic information of each port, which facilitates
you to monitor the traffic and locate faults promptly.
53