ZyXEL NWA110AX User Guide - Page 81
Port Statistics Graph, Monitor > Network Status, Switch to Graphic View, LABEL, DESCRIPTION
 |
View all ZyXEL NWA110AX manuals
Add to My Manuals
Save this manual to your list of manuals |
Page 81 highlights
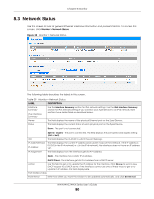
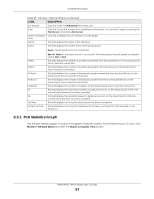
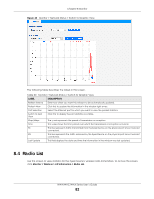
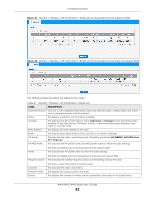
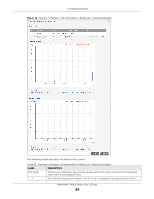
Chapter 8 Monitor Table 29 Monitor > Network Status (continued) LABEL DESCRIPTION Set Interval Stop Switch to Graphic View Name Status Click this to set the Poll Interval the screen uses. Click this to stop the window from updating automatically. You can start it again by setting the Poll Interval and clicking Set Interval. Click this to display the port statistics as a line graph. This field displays the name of the interface. This field displays the current status of the physical port. Down - The physical port is not connected. TxPkts RxPkts Tx Bcast Rx Bcast Collisions Tx Rx Up Time System Up Time Speed / Duplex - The physical port is connected. This field displays the port speed and duplex setting (Full or Half). This field displays the number of packets transmitted from the Zyxel Device on the physical port since it was last connected. This field displays the number of packets received by the Zyxel Device on the physical port since it was last connected. This field displays the number of broadcast packets transmitted from the Zyxel Device on the physical port since it was last connected. This field displays the number of broadcast packets received by the Zyxel Device on the physical port since it was last connected. This field displays the number of collisions on the physical port since it was last connected. This field displays the transmission speed, in bytes per second, on the physical port in the onesecond interval before the screen updated. This field displays the reception speed, in bytes per second, on the physical port in the onesecond interval before the screen updated. This field displays how long the physical port has been connected. This field displays how long the Zyxel Device has been running since it last restarted or was turned on. 8.3.1 Port Statistics Graph Use the port statistics graph to look at a line graph of packet statistics for the Ethernet port. To view, click Monitor > Network Status and then the Switch to Graphic View button. NWA/WAC/WAX Series User's Guide 81
-
 1
1 -
2
-
3
-
4
-
5
-
6
-
7
-
8
-
9
-
10
-
11
-
12
-
13
-
14
-
15
-
16
-
17
-
18
-
19
-
20
-
21
-
22
-
23
-
24
-
25
-
26
-
27
-
28
-
29
-
30
-
31
-
32
-
33
-
34
-
35
-
36
-
37
-
38
-
39
-
40
-
41
-
42
-
43
-
44
-
45
-
46
-
47
-
48
-
49
-
50
-
51
-
52
-
53
-
54
-
55
-
56
-
57
-
58
-
59
-
60
-
61
-
62
-
63
-
64
-
65
-
66
-
67
-
68
-
69
-
70
-
71
-
72
-
73
-
74
-
75
-
 76
76 -
 77
77 -
 78
78 -
 79
79 -
 80
80 -
 81
81 -
 82
82 -
 83
83 -
 84
84 -
 85
85 -
 86
86 -
87
-
88
-
89
-
90
-
91
-
92
-
93
-
94
-
95
-
96
-
97
-
98
-
99
-
100
-
101
-
102
-
103
-
104
-
105
-
106
-
107
-
108
-
109
-
110
-
111
-
112
-
113
-
114
-
115
-
116
-
117
-
118
-
119
-
120
-
121
-
122
-
123
-
124
-
125
-
126
-
127
-
128
-
129
-
130
-
131
-
132
-
133
-
134
-
135
-
136
-
137
-
138
-
139
-
140
-
141
-
142
-
143
-
144
-
145
-
146
-
147
-
148
-
149
-
150
-
151
-
152
-
153
-
154
-
155
-
156
-
157
-
158
-
159
-
160
-
161
-
162
-
163
-
164
-
165
-
166
-
167
-
168
-
169
-
170
-
171
-
172
-
173
-
174
-
175
-
176
-
177
-
178
-
179
-
180
-
181
-
182
-
183
-
184
-
185
-
186
-
187
-
188
-
189
-
190
-
191
-
192
-
193
-
194
-
195
-
196
-
197
-
198
-
199
-
200
-
201
-
202
-
203
-
204
-
205
-
206
-
207
-
208
-
209
-
210
-
211
-
212
-
213
-
214
-
215
-
216
-
217
-
218
-
219
-
220
-
221
-
222
-
223
-
224
-
225
-
226
-
227
-
228
-
229
-
230
-
231
-
232
-
233
-
234
-
235
-
236
-
237
-
238
-
239
-
240
-
241
-
242
-
243
-
244
-
245
-
246
-
247
-
248
-
249
-
250
-
251
-
252
-
253
-
254
-
255
-
256
-
257
-
258
-
259
-
260
-
261
-
262
-
263
-
264
-
265
-
266
-
267
-
268
-
269
-
270
-
271
-
272
-
273
-
274
-
275
-
276
-
277
-
278
-
279
-
280
-
281
-
282
-
283
-
284
-
285
-
286
-
287
-
288
-
289
-
290
-
291
-
292
-
293
-
294
-
295
-
296
-
297
-
298
-
299
-
300
-
301
-
302
-
303
-
304
 |
 |