HP 1606 Fabric Watch Administrator's Guide v6.4.0 (53-1001770-01, June 2010) - Page 123
Fabric Watch Threshold Components
 |
View all HP 1606 manuals
Add to My Manuals
Save this manual to your list of manuals |
Page 123 highlights
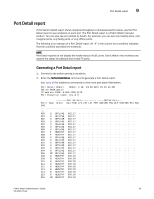
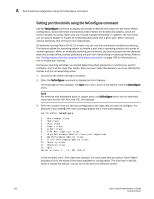
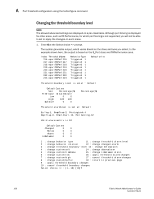
Port threshold configuration using the fwConfigure command A 4. Enter the number corresponding to the area that you want to configure, such as 7 for RXPerformance. 1 : Link loss 2 : Sync loss 3 : Signal loss (not supported) 4 : Protocol error 5 : Invalid words 6 : Invalid CRCS 7 : RXPerformance 8 : TXPerformance 9 : State Changes 10 : Link reset 11 : return to previous page Select an area => : (1..10) [10] 7 Fabric Watch displays a list of monitored elements in this area. The following sample output shows the monitored elements in the RXPerformance area menu. Index ThresholdName Port CurVal Status LastEvent LasteventTime LastVal LastState 216 eportRXPerf216 8/24 0 Percentage(%)/min enabled inBetween Tue Jun 2 14:21:01 2009 0 Percentage(%)/min Informative 217 eportRXPerf217 8/25 0 Percentage(%)/min enabled inBetween Tue Jun 2 14:21:07 2009 0 Percentage(%)/min Informative 218 eportRXPerf218 8/26 0 Percentage(%)/min enabled inBetween Tue Jun 2 14:21:07 2009 0 Percentage(%)/min Informative 219 eportRXPerf219 8/27 0 Percentage(%)/min enabled inBetween Tue Jun 2 14:21:07 2009 0 Percentage(%)/min Informative 220 eportRXPerf220 8/28 0 Percentage(%)/min enabled inBetween Tue Jun 2 14:21:07 2009 0 Percentage(%)/min Informative 221 eportRXPerf221 8/29 0 Percentage(%)/min enabled inBetween Tue Jun 2 14:21:07 2009 0 Percentage(%)/min Informative 222 eportRXPerf222 8/30 0 Percentage(%)/min enabled inBetween Tue Jun 2 14:21:07 2009 0 Percentage(%)/min Informative 223 eportRXPerf223 8/31 0 Percentage(%)/min enabled inBetween Tue Jun 2 14:21:07 2009 0 Percentage(%)/min Informative where: Index ThresholdName Port CurVal Status LastEvent LasteventTime LastVal LastState A numeric identifier assigned to the element. A string identifier assigned to the element. The user port number. The current data value contained by the element. Monitoring status, either enabled or disabled. The last event setting that triggered an event. The timestamp of the last triggered event for the element. The data value of the element at the time of the last event. The last detected state of the element. See Chapter 3, "Fabric Watch Threshold Components," for details about classes and areas. Fabric Watch Administrator's Guide 103 53-1001770-01
-
 1
1 -
2
-
3
-
4
-
5
-
6
-
7
-
8
-
9
-
10
-
11
-
12
-
13
-
14
-
15
-
16
-
17
-
18
-
19
-
20
-
21
-
22
-
23
-
24
-
25
-
26
-
27
-
28
-
29
-
30
-
31
-
32
-
33
-
34
-
35
-
36
-
37
-
38
-
39
-
40
-
41
-
42
-
43
-
44
-
45
-
46
-
47
-
48
-
49
-
50
-
51
-
52
-
53
-
54
-
55
-
56
-
57
-
58
-
59
-
60
-
61
-
62
-
63
-
64
-
65
-
66
-
67
-
68
-
69
-
70
-
71
-
72
-
73
-
74
-
75
-
76
-
77
-
78
-
79
-
80
-
81
-
82
-
83
-
84
-
85
-
86
-
87
-
88
-
89
-
90
-
91
-
92
-
93
-
94
-
95
-
96
-
97
-
98
-
99
-
100
-
101
-
102
-
103
-
104
-
105
-
106
-
107
-
108
-
109
-
110
-
111
-
112
-
113
-
114
-
115
-
116
-
117
-
 118
118 -
 119
119 -
 120
120 -
 121
121 -
 122
122 -
 123
123 -
 124
124 -
 125
125 -
 126
126 -
 127
127 -
 128
128 -
129
-
130
-
131
-
132
-
133
-
134
-
135
-
136
-
137
-
138
-
139
-
140
-
141
-
142
-
143
-
144
 |
 |
