Sony DSC-P200/R Operating Instructions - Page 28
For details on the operation, histogram. The graph display indicates a bright
 |
View all Sony DSC-P200/R manuals
Add to My Manuals
Save this manual to your list of manuals |
Page 28 highlights
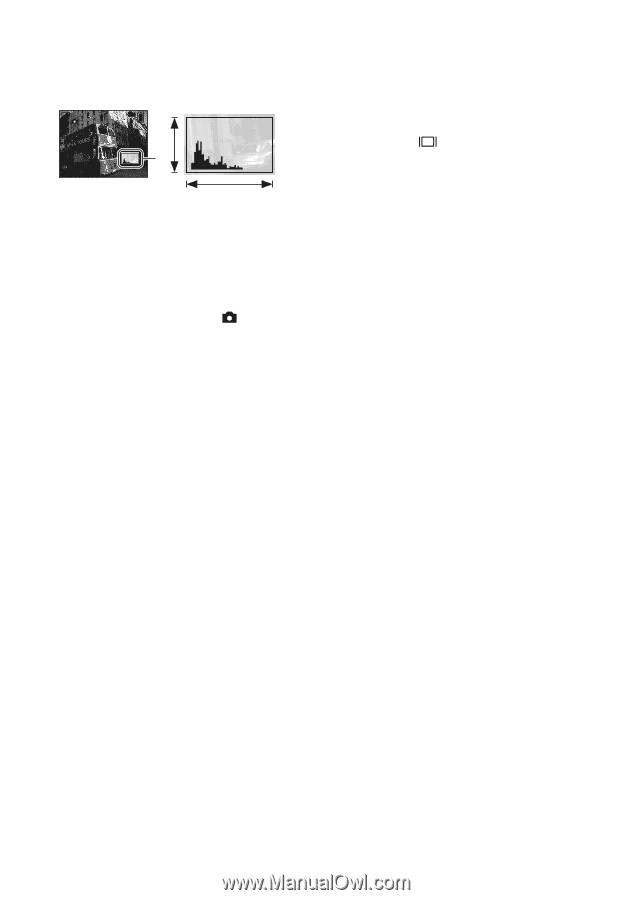
For details on the operation t page 25 z Adjusting [EV] by displaying a histogram 80min 8M FINE 101 4 A 0EV B Dark Bright A histogram is a graph showing the brightness of an image. Set the mode dial to P or SCN in advance, then press repeatedly to display the histogram. The graph display indicates a bright image when skewed to the right side, a dark image when skewed to the left side. A histogram can be used to check the exposure and adjust [EV]. A Number of pixels B Brightness • The histogram also appears in the following cases, but you cannot adjust the exposure. - When the mode dial is set to or M - When playing back a single image - During Quick Review 28
-
 1
1 -
2
-
3
-
4
-
5
-
6
-
7
-
8
-
9
-
10
-
11
-
12
-
13
-
14
-
15
-
16
-
17
-
18
-
19
-
20
-
21
-
22
-
 23
23 -
 24
24 -
 25
25 -
 26
26 -
 27
27 -
 28
28 -
 29
29 -
 30
30 -
 31
31 -
 32
32 -
 33
33 -
34
-
35
-
36
-
37
-
38
-
39
-
40
-
41
-
42
-
43
-
44
-
45
-
46
-
47
-
48
-
49
-
50
-
51
-
52
-
53
-
54
-
55
-
56
-
57
-
58
-
59
-
60
-
61
-
62
-
63
-
64
-
65
-
66
-
67
-
68
-
69
-
70
-
71
-
72
-
73
-
74
-
75
-
76
-
77
-
78
-
79
-
80
-
81
-
82
-
83
-
84
-
85
-
86
-
87
-
88
-
89
-
90
-
91
-
92
-
93
-
94
-
95
-
96
-
97
-
98
-
99
 |
 |
28
For details on the operation
t
page 25
z
Adjusting [EV] by displaying a histogram
A histogram is a graph showing the brightness of
an image. Set the mode dial to P or SCN in
advance, then press
repeatedly to display the
histogram. The graph display indicates a bright
image when skewed to the right side, a dark
image when skewed to the left side. A histogram
can be used to check the exposure and adjust
[EV].
A
Number of pixels
B
Brightness
•
The histogram also appears in the following cases, but you cannot adjust the exposure.
–
When the mode dial is set to
or M
–
When playing back a single image
–
During Quick Review
8M
4
FINE
101
0
EV
80min
Bright
Dark
A
B