Yamaha LS9-32 Ls9 Editor Owner's Manual - Page 79
Time Axis Set button, Filter Frequency Response Curve
 |
View all Yamaha LS9-32 manuals
Add to My Manuals
Save this manual to your list of manuals |
Page 79 highlights
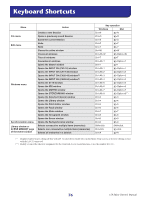
8 M N N N J K 7 O L M Filter Frequency Response Curve The curve changes depending on the HPF and LPF values. N Reverberation images These images represent the high-range (10kHz), mid-range (1kHz), and low-range (100Hz) reverberation. These images change shape depending on the parameter values. The vertical axis represents the level; the horizontal axis represents reverb time; the shape represents the envelope. O Reverb time curve This curve represents the high-range (10kHz), mid-range (1kHz), and low-range (100Hz) reverb time. The curve changes depending on the Reverb Time, Hi Ratio, and Lo Ratio parameter values. P Q RS P [Auto Zoom] button Click the button to automatically adjust the time axis (horizontal axis). Q Time Axis Set button Use this button to specify the time duration (in seconds) as displayed by the time axis (horizontal axis). R [ ] (Zoom Out) button Click this button to increase the time value (in seconds) as displayed by the time axis (horizontal axis). As a result, the display zooms out on the horizontal axis. S [ ] (Zoom In) button Click this button to decrease the time value (in seconds) as displayed by the time axis (horizontal axis). As a result, the display zooms in on the horizontal axis. 6 T T [OUTPUT] meter This indicates the output level of the effect. U RS U [MIX] slider These controls enable you to adjust the mix balance of the dry and wet (effect) sounds. When the balance is 0%, only the dry sound is output. When the balance is 100%, only the wet sound is output. NOTE The range is from 0 through 100%. 79 LS9 Editor Owner's Manual
-
 1
1 -
2
-
3
-
4
-
5
-
6
-
7
-
8
-
9
-
10
-
11
-
12
-
13
-
14
-
15
-
16
-
17
-
18
-
19
-
20
-
21
-
22
-
23
-
24
-
25
-
26
-
27
-
28
-
29
-
30
-
31
-
32
-
33
-
34
-
35
-
36
-
37
-
38
-
39
-
40
-
41
-
42
-
43
-
44
-
45
-
46
-
47
-
48
-
49
-
50
-
51
-
52
-
53
-
54
-
55
-
56
-
57
-
58
-
59
-
60
-
61
-
62
-
63
-
64
-
65
-
66
-
67
-
68
-
69
-
70
-
71
-
72
-
73
-
 74
74 -
 75
75 -
 76
76 -
 77
77 -
 78
78 -
 79
79 -
 80
80
 |
 |
