Epson LX-90 User Manual - Parallel 8620 PIC for LX-90 - Page 55
Chap 8-introduction To Dot Graphics
 |
View all Epson LX-90 manuals
Add to My Manuals
Save this manual to your list of manuals |
Page 55 highlights
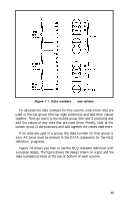
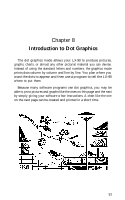
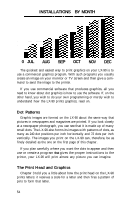
Chapter 8 Introduction to Dot Graphics The dot graphics mode allows your LX-90 to produce pictures, graphs, charts, or almost any other pictorial material you can devise. Instead of using the standard letters and numbers, the graphics mode prints dots column by column and line by line. You plan where you want the dots to appear and then use a program to tell the LX-90 where to put them. Because many software programs use dot graphics, you may be able to print pictures and graphs like the ones on this page and the next by simply giving your software a few instructions. A chart like the one on the next page can be created and printed in a short time. 53
-
 1
1 -
2
-
3
-
4
-
5
-
6
-
7
-
8
-
9
-
10
-
11
-
12
-
13
-
14
-
15
-
16
-
17
-
18
-
19
-
20
-
21
-
22
-
23
-
24
-
25
-
26
-
27
-
28
-
29
-
30
-
31
-
32
-
33
-
34
-
35
-
36
-
37
-
38
-
39
-
40
-
41
-
42
-
43
-
44
-
45
-
46
-
47
-
48
-
49
-
 50
50 -
 51
51 -
 52
52 -
 53
53 -
 54
54 -
 55
55 -
 56
56 -
 57
57 -
 58
58 -
 59
59 -
 60
60 -
61
-
62
-
63
-
64
-
65
-
66
-
67
-
68
-
69
-
70
-
71
-
72
-
73
-
74
-
75
-
76
-
77
-
78
-
79
-
80
-
81
-
82
-
83
-
84
-
85
-
86
-
87
-
88
-
89
-
90
-
91
-
92
-
93
-
94
-
95
-
96
-
97
-
98
-
99
-
100
-
101
-
102
-
103
-
104
-
105
-
106
-
107
-
108
-
109
-
110
-
111
-
112
-
113
-
114
-
115
-
116
-
117
-
118
-
119
-
120
-
121
-
122
 |
 |

Chapter 8
Introduction to Dot Graphics
The dot graphics mode allows your LX-90 to produce pictures,
graphs, charts, or almost any other pictorial material you can devise.
Instead of using the standard letters and numbers, the graphics mode
prints dots column by column and line by line. You plan where you
want the dots to appear and then use a program to tell the LX-90
where to put them.
Because many software programs use dot graphics, you may be
able to print pictures and graphs like the ones on this page and the next
by simply giving your software a few instructions. A chart like the one
on the next page can be created and printed in a short time.
53