Epson LX-90 User Manual - Parallel 8620 PIC for LX-90 - Page 64
Designing Your Own Graphics, CHR$27LCHR$N MOD 256CHR$INTN/256
 |
View all Epson LX-90 manuals
Add to My Manuals
Save this manual to your list of manuals |
Page 64 highlights
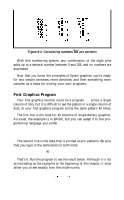
Once you have chosen the number of columns you want to use, you can have your program do the calculations for you with the following format: CHR$(27)"L"CHR$(N MOD 256)CHR$(INT(N/256)); N is the total number of columns you want to specify. The MOD (modulus) function calculates the value for nl, and the INT (integer) function calculates the value for n2. For programming languages other than BASIC, consult your manual for the proper form for these functions. This format can be used with any graphics density and with any value of N up to the maximum number of columns per line for that density. Designing Your Own Graphics This section takes you through the development of a graphics program. The example is not especially complicated, but it does include the same steps you would use for a more complex figure so that you have the basis for designing graphics on your LX-90. You should plan your figure with dots on graph paper, but before beginning to place the dots, you must decide which graphics density you want. Figure 8-3 shows the differences among the three most-used graphics modes so that you can choose the one you want. Figure 8-3. Designing in different densities In this figure you can see the main rules for graphic design in the three densities. In single density no dots can be placed on vertical lines. In high-speed double density dots can be placed on vertical 62
-
 1
1 -
2
-
3
-
4
-
5
-
6
-
7
-
8
-
9
-
10
-
11
-
12
-
13
-
14
-
15
-
16
-
17
-
18
-
19
-
20
-
21
-
22
-
23
-
24
-
25
-
26
-
27
-
28
-
29
-
30
-
31
-
32
-
33
-
34
-
35
-
36
-
37
-
38
-
39
-
40
-
41
-
42
-
43
-
44
-
45
-
46
-
47
-
48
-
49
-
50
-
51
-
52
-
53
-
54
-
55
-
56
-
57
-
58
-
 59
59 -
 60
60 -
 61
61 -
 62
62 -
 63
63 -
 64
64 -
 65
65 -
 66
66 -
 67
67 -
 68
68 -
 69
69 -
70
-
71
-
72
-
73
-
74
-
75
-
76
-
77
-
78
-
79
-
80
-
81
-
82
-
83
-
84
-
85
-
86
-
87
-
88
-
89
-
90
-
91
-
92
-
93
-
94
-
95
-
96
-
97
-
98
-
99
-
100
-
101
-
102
-
103
-
104
-
105
-
106
-
107
-
108
-
109
-
110
-
111
-
112
-
113
-
114
-
115
-
116
-
117
-
118
-
119
-
120
-
121
-
122
 |
 |
