Garmin eTrex Vista Owner's Manual - Page 32
View Elevation Plot', 'View Pressure Plot', 'Zoom Ranges
 |
UPC - 753759028329
View all Garmin eTrex Vista manuals
Add to My Manuals
Save this manual to your list of manuals |
Page 32 highlights
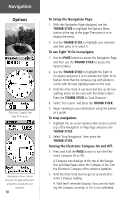
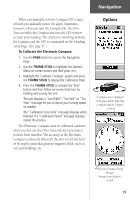
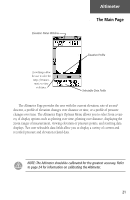
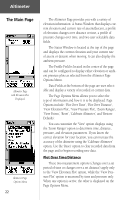
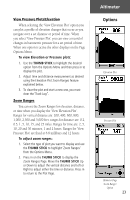
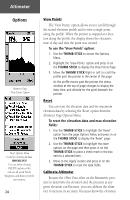
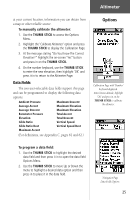
Altimeter The Main Page Altimeter Page with Elevation Plot Displayed Altimeter Page Options Menu 22 The Altimeter Page provides you with a variety of elevation information: A Status Window that displays current elevation and current rate of ascent/descent, a profile of elevation changes over distance or time, a profile of pressure changes over time, and two user selectable data fields. The Status Window is located at the top of the page and displays the current elevation and your current rate of ascent or descent when moving. It can also display the ambient pressure. The Profile Field is located in the center of the page and can be configured to display either elevation or ambient pressure plots as selected from the Altimeter Page Options Menu. Data Fields at the bottom of the page are user selectable and display a variety of recorded or current data. The Page Options Menu allows you to select the type of information and how it is to be displayed. Page Options include: 'Plot Over Time', 'Plot Over Distance', 'View Elevation Plot', 'View Pressure Plot', 'Zoom Ranges', 'View Points', 'Reset', 'Calibrate Altimeter', and 'Restore Defaults'. You can customize the 'View' option displays using the 'Zoom Ranges' option to determine time, distance, pressure, and elevation parameters. If you know the correct elevation for your location, you can increase the accuracy of the altimeter using the 'Calibrate Altimeter' option. Use the 'Reset' option to clear recorded data from the page and to begin recording new data. Plot Over Time/Distance These two measurement options (changes over a set period of time or changes over a set distance) apply only to the 'View Elevation Plot' option, while the 'View Pressure Plot' option is measured by time and pressure only. When one option is active, the other is displayed on the Page Options Menu.
-
 1
1 -
2
-
3
-
4
-
5
-
6
-
7
-
8
-
9
-
10
-
11
-
12
-
13
-
14
-
15
-
16
-
17
-
18
-
19
-
20
-
21
-
22
-
23
-
24
-
25
-
26
-
 27
27 -
 28
28 -
 29
29 -
 30
30 -
 31
31 -
 32
32 -
 33
33 -
 34
34 -
 35
35 -
 36
36 -
 37
37 -
38
-
39
-
40
-
41
-
42
-
43
-
44
-
45
-
46
-
47
-
48
-
49
-
50
-
51
-
52
-
53
-
54
-
55
-
56
-
57
-
58
-
59
-
60
-
61
-
62
-
63
-
64
-
65
-
66
-
67
-
68
-
69
-
70
-
71
-
72
-
73
-
74
-
75
-
76
-
77
-
78
-
79
-
80
-
81
-
82
-
83
-
84
 |
 |
