Garmin eTrex Vista Owner's Manual - Page 33
Options Menu.
 |
UPC - 753759028329
View all Garmin eTrex Vista manuals
Add to My Manuals
Save this manual to your list of manuals |
Page 33 highlights
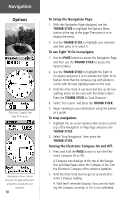
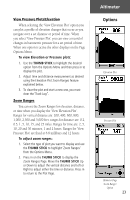
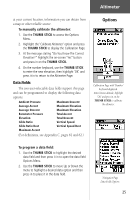
View Pressure Plots/Elevation When selecting the 'View Elevation Plot' option you can plot a profile of elevation changes that occur as you navigate over a set distance or period of time. When you select 'View Pressure Plot' you can view a record of changes in barometric pressure for a set period of time. When one option is active the other displays on the Page Options Menu. To view Elevation or Pressure plots: 1. Use the THUMB STICK to highlight the desired option from the Options Menu and then press in to display the plot. 2. Adjust time and distance measurement as desired using the Elevation Plot Zoom Ranges feature explained below. 3. To clear the plot and start a new one, you must clear the 'Track Log". Zoom Ranges You can set the Zoom Ranges for elevation, distance, or time when you display the 'View Elevation Plot'. Ranges for vertical distance are: 200, 400, 600, 800, 1,000, 2,500 and 5,000 feet. ranges for distance are: 0.2, 0.5, 1, 5, 10, 15, and 25 miles. Ranges for time are: 2, 5, 10, 20 and 30 minutes, 1 and 2 hours. Ranges for 'View Pressure Plot' are fixed at 6.8 millibars and 12 hours. To adjust zoom ranges: 1. Select the type of plot you want to display and use the THUMB STICK to highlight 'Zoom Ranges' from the Options Menu. 2. Press in on the THUMB STICK to display the Zoom Ranges Page. Move the THUMB STICK Up or Down to adjust the vertical distance and Left or Right to adjust either the time or distance. Press in to return to the Plot Page. Altimeter Options Elevation Plot Pressure Plot Altimeter Page 'Zoom Ranges' Option 23
-
 1
1 -
2
-
3
-
4
-
5
-
6
-
7
-
8
-
9
-
10
-
11
-
12
-
13
-
14
-
15
-
16
-
17
-
18
-
19
-
20
-
21
-
22
-
23
-
24
-
25
-
26
-
27
-
 28
28 -
 29
29 -
 30
30 -
 31
31 -
 32
32 -
 33
33 -
 34
34 -
 35
35 -
 36
36 -
 37
37 -
 38
38 -
39
-
40
-
41
-
42
-
43
-
44
-
45
-
46
-
47
-
48
-
49
-
50
-
51
-
52
-
53
-
54
-
55
-
56
-
57
-
58
-
59
-
60
-
61
-
62
-
63
-
64
-
65
-
66
-
67
-
68
-
69
-
70
-
71
-
72
-
73
-
74
-
75
-
76
-
77
-
78
-
79
-
80
-
81
-
82
-
83
-
84
 |
 |
