HP 8/40 Brocade Fabric OS Command Reference v6.3.0 (53-1001337-01, July 2009) - Page 96
bottleneckMon, Enabled Y or disabled N.
 |
View all HP 8/40 manuals
Add to My Manuals
Save this manual to your list of manuals |
Page 96 highlights
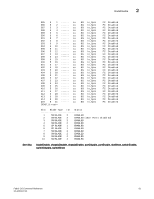
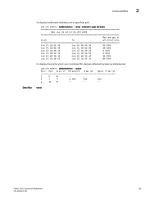
2 bottleneckMon bottleneckMon Synopsis Monitors and reports latency bottleneck conditions on F_Ports. bottleneckmon --enable [ -alert ] [-thresh threshold] [-time window] [-qtime quiet_time] [slot/]port_list [[slot ]port_list] ... bottleneckmon --disable [slot ]/port_list [[slot ]port_list] ... bottleneckmon --show [-interval interval ] [-span span_size] [slot/]port bottleneckmon --status bottleneckmon --help Description Use this command to control the monitoring of latency bottlenecks on F_Ports, to enable and configure alerts for detected bottlenecks, and to display statistics on bottleneck events on a specified port. A latency bottleneck occurs when egress throughput at a port is lower than the offered load because of latency in the return of credits from the other end of the link. This is not a permanent condition. The load does not exceed the physical capacity of the channel as such, but can occur because of an underperforming device connected to the fabric port. Bottleneck monitoring can help identify these devices. When bottleneck monitoring is enabled on a port and -alert is specified, the command triggers RASLOG alerts when the port is experiencing latency depending on the configured alert parameters. The command takes a sample every second to determine if the port is affected by a latency bottleneck. You can configure a severity threshold and the time interval over which the bottleneck is measured. For example, setting a threshold of 0.8 and a time window of 30 seconds specifies that an alert should be sent when 80% of the one-second samples over any period of 30 seconds were affected by bottleneck conditions. The -qtime option can be used to throttle alerts by specifying the minimum number of seconds between consecutive alerts. The alerting parameters cannot be modified on a port where bottleneck detection is enabled. You must first disable and then re-enable alerting with new parameters. Bottleneck monitoring works both in non-Virtual Fabric mode and in Virtual Fabric Mode. If Virtual Fabrics are enabled, bottleneck monitoring is configured per logical switch. If a port is removed from a logical switch after bottleneck detection is enabled on the port, the configuration is retained in that logical switch. If the port is added again to the same logical switch, bottleneck detection is automatically re-enabled for this port using the retained configuration. This feature allows you to configure more than one logical switch to perform bottleneck detection on the same port, although only one logical switch performs the operation on the port at any given time. The --show option displays a history of the bottleneck severity on the specified port. Each line of output shows the percentage of one-second intervals affected by latency during the time window shown on that line. The following information is displayed: Alerts? Enabled (Y) or disabled (N). Threshold The severity threshold for triggering an alert. This threshold indicates the percentage of one-second intervals affected by the bottleneck condition within a specified time window. The severity threshold is expressed as a fraction between 0 and 1. Time (s) The time window in seconds over which the bottlenecking percentage is computed and compared with the threshold. 66 Fabric OS Command Reference 53-1001337-01
-
 1
1 -
2
-
3
-
4
-
5
-
6
-
7
-
8
-
9
-
10
-
11
-
12
-
13
-
14
-
15
-
16
-
17
-
18
-
19
-
20
-
21
-
22
-
23
-
24
-
25
-
26
-
27
-
28
-
29
-
30
-
31
-
32
-
33
-
34
-
35
-
36
-
37
-
38
-
39
-
40
-
41
-
42
-
43
-
44
-
45
-
46
-
47
-
48
-
49
-
50
-
51
-
52
-
53
-
54
-
55
-
56
-
57
-
58
-
59
-
60
-
61
-
62
-
63
-
64
-
65
-
66
-
67
-
68
-
69
-
70
-
71
-
72
-
73
-
74
-
75
-
76
-
77
-
78
-
79
-
80
-
81
-
82
-
83
-
84
-
85
-
86
-
87
-
88
-
89
-
90
-
 91
91 -
 92
92 -
 93
93 -
 94
94 -
 95
95 -
 96
96 -
 97
97 -
 98
98 -
 99
99 -
 100
100 -
 101
101 -
102
-
103
-
104
-
105
-
106
-
107
-
108
-
109
-
110
-
111
-
112
-
113
-
114
-
115
-
116
-
117
-
118
-
119
-
120
-
121
-
122
-
123
-
124
-
125
-
126
-
127
-
128
-
129
-
130
-
131
-
132
-
133
-
134
-
135
-
136
-
137
-
138
-
139
-
140
-
141
-
142
-
143
-
144
-
145
-
146
-
147
-
148
-
149
-
150
-
151
-
152
-
153
-
154
-
155
-
156
-
157
-
158
-
159
-
160
-
161
-
162
-
163
-
164
-
165
-
166
-
167
-
168
-
169
-
170
-
171
-
172
-
173
-
174
-
175
-
176
-
177
-
178
-
179
-
180
-
181
-
182
-
183
-
184
-
185
-
186
-
187
-
188
-
189
-
190
-
191
-
192
-
193
-
194
-
195
-
196
-
197
-
198
-
199
-
200
-
201
-
202
-
203
-
204
-
205
-
206
-
207
-
208
-
209
-
210
-
211
-
212
-
213
-
214
-
215
-
216
-
217
-
218
-
219
-
220
-
221
-
222
-
223
-
224
-
225
-
226
-
227
-
228
-
229
-
230
-
231
-
232
-
233
-
234
-
235
-
236
-
237
-
238
-
239
-
240
-
241
-
242
-
243
-
244
-
245
-
246
-
247
-
248
-
249
-
250
-
251
-
252
-
253
-
254
-
255
-
256
-
257
-
258
-
259
-
260
-
261
-
262
-
263
-
264
-
265
-
266
-
267
-
268
-
269
-
270
-
271
-
272
-
273
-
274
-
275
-
276
-
277
-
278
-
279
-
280
-
281
-
282
-
283
-
284
-
285
-
286
-
287
-
288
-
289
-
290
-
291
-
292
-
293
-
294
-
295
-
296
-
297
-
298
-
299
-
300
-
301
-
302
-
303
-
304
-
305
-
306
-
307
-
308
-
309
-
310
-
311
-
312
-
313
-
314
-
315
-
316
-
317
-
318
-
319
-
320
-
321
-
322
-
323
-
324
-
325
-
326
-
327
-
328
-
329
-
330
-
331
-
332
-
333
-
334
-
335
-
336
-
337
-
338
-
339
-
340
-
341
-
342
-
343
-
344
-
345
-
346
-
347
-
348
-
349
-
350
-
351
-
352
-
353
-
354
-
355
-
356
-
357
-
358
-
359
-
360
-
361
-
362
-
363
-
364
-
365
-
366
-
367
-
368
-
369
-
370
-
371
-
372
-
373
-
374
-
375
-
376
-
377
-
378
-
379
-
380
-
381
-
382
-
383
-
384
-
385
-
386
-
387
-
388
-
389
-
390
-
391
-
392
-
393
-
394
-
395
-
396
-
397
-
398
-
399
-
400
-
401
-
402
-
403
-
404
-
405
-
406
-
407
-
408
-
409
-
410
-
411
-
412
-
413
-
414
-
415
-
416
-
417
-
418
-
419
-
420
-
421
-
422
-
423
-
424
-
425
-
426
-
427
-
428
-
429
-
430
-
431
-
432
-
433
-
434
-
435
-
436
-
437
-
438
-
439
-
440
-
441
-
442
-
443
-
444
-
445
-
446
-
447
-
448
-
449
-
450
-
451
-
452
-
453
-
454
-
455
-
456
-
457
-
458
-
459
-
460
-
461
-
462
-
463
-
464
-
465
-
466
-
467
-
468
-
469
-
470
-
471
-
472
-
473
-
474
-
475
-
476
-
477
-
478
-
479
-
480
-
481
-
482
-
483
-
484
-
485
-
486
-
487
-
488
-
489
-
490
-
491
-
492
-
493
-
494
-
495
-
496
-
497
-
498
-
499
-
500
-
501
-
502
-
503
-
504
-
505
-
506
-
507
-
508
-
509
-
510
-
511
-
512
-
513
-
514
-
515
-
516
-
517
-
518
-
519
-
520
-
521
-
522
-
523
-
524
-
525
-
526
-
527
-
528
-
529
-
530
-
531
-
532
-
533
-
534
-
535
-
536
-
537
-
538
-
539
-
540
-
541
-
542
-
543
-
544
-
545
-
546
-
547
-
548
-
549
-
550
-
551
-
552
-
553
-
554
-
555
-
556
-
557
-
558
-
559
-
560
-
561
-
562
-
563
-
564
-
565
-
566
-
567
-
568
-
569
-
570
-
571
-
572
-
573
-
574
-
575
-
576
-
577
-
578
-
579
-
580
-
581
-
582
-
583
-
584
-
585
-
586
-
587
-
588
-
589
-
590
-
591
-
592
-
593
-
594
-
595
-
596
-
597
-
598
-
599
-
600
-
601
-
602
-
603
-
604
-
605
-
606
-
607
-
608
-
609
-
610
-
611
-
612
-
613
-
614
-
615
-
616
-
617
-
618
-
619
-
620
-
621
-
622
-
623
-
624
-
625
-
626
-
627
-
628
-
629
-
630
-
631
-
632
-
633
-
634
-
635
-
636
-
637
-
638
-
639
-
640
-
641
-
642
-
643
-
644
-
645
-
646
-
647
-
648
-
649
-
650
-
651
-
652
-
653
-
654
-
655
-
656
-
657
-
658
-
659
-
660
-
661
-
662
-
663
-
664
-
665
-
666
-
667
-
668
-
669
-
670
-
671
-
672
-
673
-
674
-
675
-
676
-
677
-
678
-
679
-
680
-
681
-
682
-
683
-
684
-
685
-
686
-
687
-
688
-
689
-
690
-
691
-
692
-
693
-
694
-
695
-
696
-
697
-
698
-
699
-
700
-
701
-
702
-
703
-
704
-
705
-
706
-
707
-
708
-
709
-
710
-
711
-
712
-
713
-
714
-
715
-
716
-
717
-
718
-
719
-
720
-
721
-
722
-
723
-
724
-
725
-
726
-
727
-
728
-
729
-
730
-
731
-
732
-
733
-
734
-
735
-
736
-
737
-
738
-
739
-
740
-
741
-
742
-
743
-
744
-
745
-
746
-
747
-
748
-
749
-
750
-
751
-
752
-
753
-
754
-
755
-
756
-
757
-
758
-
759
-
760
-
761
-
762
-
763
-
764
-
765
-
766
-
767
-
768
-
769
-
770
-
771
-
772
-
773
-
774
-
775
-
776
-
777
-
778
-
779
-
780
-
781
-
782
-
783
-
784
-
785
-
786
-
787
-
788
-
789
-
790
-
791
-
792
-
793
-
794
-
795
-
796
-
797
-
798
-
799
-
800
-
801
-
802
-
803
-
804
-
805
-
806
-
807
-
808
-
809
-
810
-
811
-
812
-
813
-
814
-
815
-
816
-
817
-
818
-
819
-
820
-
821
-
822
-
823
-
824
-
825
-
826
-
827
-
828
-
829
-
830
-
831
-
832
-
833
-
834
-
835
-
836
-
837
-
838
-
839
-
840
-
841
-
842
-
843
-
844
-
845
-
846
-
847
-
848
-
849
-
850
-
851
-
852
-
853
-
854
-
855
-
856
-
857
-
858
-
859
-
860
-
861
-
862
-
863
-
864
-
865
-
866
-
867
-
868
-
869
-
870
-
871
-
872
-
873
-
874
-
875
-
876
-
877
-
878
-
879
-
880
-
881
-
882
-
883
-
884
-
885
-
886
-
887
-
888
-
889
-
890
-
891
-
892
-
893
-
894
-
895
-
896
-
897
-
898
-
899
-
900
-
901
-
902
-
903
-
904
-
905
-
906
-
907
-
908
-
909
-
910
-
911
-
912
-
913
-
914
-
915
-
916
-
917
-
918
-
919
-
920
-
921
-
922
-
923
-
924
-
925
-
926
-
927
-
928
-
929
-
930
-
931
-
932
-
933
-
934
-
935
-
936
-
937
-
938
-
939
-
940
-
941
-
942
-
943
-
944
-
945
-
946
-
947
-
948
-
949
-
950
-
951
-
952
-
953
-
954
-
955
-
956
-
957
-
958
-
959
-
960
-
961
-
962
-
963
-
964
-
965
-
966
-
967
-
968
-
969
-
970
-
971
-
972
-
973
-
974
-
975
-
976
-
977
-
978
-
979
-
980
-
981
-
982
-
983
-
984
-
985
-
986
-
987
-
988
 |
 |
