HP Brocade BladeSystem 4/12 HP StorageWorks Fabric OS 6.1.1 administrator guid - Page 370
Adding a monitor to an F_Port master port, Displaying port throughput performance
 |
View all HP Brocade BladeSystem 4/12 manuals
Add to My Manuals
Save this manual to your list of manuals |
Page 370 highlights
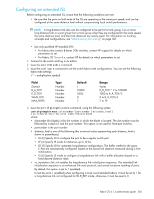
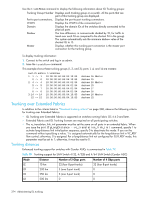
Adding a monitor to an F_Port master port 1. Connect to the switch and log in as admin. 2. Issue the perfAddEEMonitor command: switch:admin> perfaddeemonitor 4 0x010400 0x020800 Adding monitor to the master port of the F-Port Trunk. where 4 is a slave port of the F_Port Trunk. If you attempt to install a monitor on a slave port of an F_Port trunk and the same monitor is already installed on the corresponding master, the following message is displayed: switch:admin> perfaddeemonitor 4 0x010400 0x020800 Similar monitor already exists on the master port of the F-Port Trunk where 4 is a slave port of the F_Port Trunk. • Fabric Watch allows you to monitor traffic flow through specified ports on the switch and send alerts when the traffic exceeds or drops below configured thresholds. Fabric Watch monitors only the trunk masters and not the slave ports. Use the fwConfigure command to display and modify the Fabric Watch configuration. Because the index is the same for all ports in the trunk, Fabric Watch shows the master trunk port counter values for all slaves when you issue the fwConfigure command. You can issue the fwPortDetailShow command to display the overall status of specific ports. See the Fabric Watch Administrator's Guide for additional information. • The Fabric OS CLI portPerfShow command allows you to display throughput information for all ports on the switch. Data displays in 8 or 16 columns, one column per port plus one column that displays the total for these ports. Results display every second or over the specified interval, until Enter, Ctrl-C, or Ctrl-D is pressed. This command displays the number of bytes received plus the number of bytes transmitted per interval. Throughput values are displayed as either bytes, kilobytes (k), megabytes (m), or gigabytes (g). Values are always rounded down. Displaying port throughput performance 1. Connect to the switch and log in as admin. 2. Issue the following command: portperfshow [interval] where interval is the number of seconds between each data-gathering sample (the default is one sample every second). 3. Record the traffic flow for each port participating in an ISL. 4. Repeat step 1 through step 3 for each switch in the fabric until all ISL traffic flow is captured. In a large fabric, it may be necessary only to identify and capture the key ISLs. However, you may want to continue this process throughout the day (or an entire work cycle), to capture varying traffic patterns under different conditions. The following example shows a switch without trunking, and indicates that ports 0 through 2 are under utilized and ports 4 and 5 are congested: switch:admin> portperfshow 0 1 2 3 4567 Total 0 0 0 145m204m202m0168m 719 0 0 0 145m206m208m0186m 745 370 Administering ISL trunking
-
 1
1 -
2
-
3
-
4
-
5
-
6
-
7
-
8
-
9
-
10
-
11
-
12
-
13
-
14
-
15
-
16
-
17
-
18
-
19
-
20
-
21
-
22
-
23
-
24
-
25
-
26
-
27
-
28
-
29
-
30
-
31
-
32
-
33
-
34
-
35
-
36
-
37
-
38
-
39
-
40
-
41
-
42
-
43
-
44
-
45
-
46
-
47
-
48
-
49
-
50
-
51
-
52
-
53
-
54
-
55
-
56
-
57
-
58
-
59
-
60
-
61
-
62
-
63
-
64
-
65
-
66
-
67
-
68
-
69
-
70
-
71
-
72
-
73
-
74
-
75
-
76
-
77
-
78
-
79
-
80
-
81
-
82
-
83
-
84
-
85
-
86
-
87
-
88
-
89
-
90
-
91
-
92
-
93
-
94
-
95
-
96
-
97
-
98
-
99
-
100
-
101
-
102
-
103
-
104
-
105
-
106
-
107
-
108
-
109
-
110
-
111
-
112
-
113
-
114
-
115
-
116
-
117
-
118
-
119
-
120
-
121
-
122
-
123
-
124
-
125
-
126
-
127
-
128
-
129
-
130
-
131
-
132
-
133
-
134
-
135
-
136
-
137
-
138
-
139
-
140
-
141
-
142
-
143
-
144
-
145
-
146
-
147
-
148
-
149
-
150
-
151
-
152
-
153
-
154
-
155
-
156
-
157
-
158
-
159
-
160
-
161
-
162
-
163
-
164
-
165
-
166
-
167
-
168
-
169
-
170
-
171
-
172
-
173
-
174
-
175
-
176
-
177
-
178
-
179
-
180
-
181
-
182
-
183
-
184
-
185
-
186
-
187
-
188
-
189
-
190
-
191
-
192
-
193
-
194
-
195
-
196
-
197
-
198
-
199
-
200
-
201
-
202
-
203
-
204
-
205
-
206
-
207
-
208
-
209
-
210
-
211
-
212
-
213
-
214
-
215
-
216
-
217
-
218
-
219
-
220
-
221
-
222
-
223
-
224
-
225
-
226
-
227
-
228
-
229
-
230
-
231
-
232
-
233
-
234
-
235
-
236
-
237
-
238
-
239
-
240
-
241
-
242
-
243
-
244
-
245
-
246
-
247
-
248
-
249
-
250
-
251
-
252
-
253
-
254
-
255
-
256
-
257
-
258
-
259
-
260
-
261
-
262
-
263
-
264
-
265
-
266
-
267
-
268
-
269
-
270
-
271
-
272
-
273
-
274
-
275
-
276
-
277
-
278
-
279
-
280
-
281
-
282
-
283
-
284
-
285
-
286
-
287
-
288
-
289
-
290
-
291
-
292
-
293
-
294
-
295
-
296
-
297
-
298
-
299
-
300
-
301
-
302
-
303
-
304
-
305
-
306
-
307
-
308
-
309
-
310
-
311
-
312
-
313
-
314
-
315
-
316
-
317
-
318
-
319
-
320
-
321
-
322
-
323
-
324
-
325
-
326
-
327
-
328
-
329
-
330
-
331
-
332
-
333
-
334
-
335
-
336
-
337
-
338
-
339
-
340
-
341
-
342
-
343
-
344
-
345
-
346
-
347
-
348
-
349
-
350
-
351
-
352
-
353
-
354
-
355
-
356
-
357
-
358
-
359
-
360
-
361
-
362
-
363
-
364
-
 365
365 -
 366
366 -
 367
367 -
 368
368 -
 369
369 -
 370
370 -
 371
371 -
 372
372 -
 373
373 -
 374
374 -
 375
375 -
376
-
377
-
378
-
379
-
380
-
381
-
382
-
383
-
384
-
385
-
386
-
387
-
388
-
389
-
390
-
391
-
392
-
393
-
394
-
395
-
396
-
397
-
398
-
399
-
400
-
401
-
402
-
403
-
404
-
405
-
406
-
407
-
408
-
409
-
410
-
411
-
412
-
413
-
414
-
415
-
416
-
417
-
418
-
419
-
420
-
421
-
422
-
423
-
424
-
425
-
426
-
427
-
428
-
429
-
430
-
431
-
432
-
433
-
434
-
435
-
436
-
437
-
438
-
439
-
440
-
441
-
442
-
443
-
444
-
445
-
446
-
447
-
448
-
449
-
450
-
451
-
452
-
453
-
454
-
455
-
456
-
457
-
458
-
459
-
460
-
461
-
462
-
463
-
464
-
465
-
466
-
467
-
468
-
469
-
470
-
471
-
472
-
473
-
474
-
475
-
476
-
477
-
478
-
479
-
480
-
481
-
482
-
483
-
484
-
485
-
486
-
487
-
488
-
489
-
490
-
491
-
492
-
493
-
494
-
495
-
496
 |
 |