Lantronix EDS4100 EDS - User Guide - Page 130
Processes, Maintenance and Diagnostics Settings, EDS User Guide
 |
View all Lantronix EDS4100 manuals
Add to My Manuals
Save this manual to your list of manuals |
Page 130 highlights
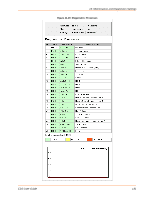
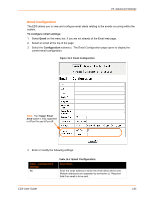
14: Maintenance and Diagnostics Settings Figure 14-29 Diagnostics: Buffer Pools Processes The Processes web page shows all the processes currently running on the system. It shows the Process ID (PID), the percentage of total CPU cycles a process used within the last three seconds, the total stack space available, the maximum amount of stack space used by the process since it started, and the process name. To display the processes running and their associated statistics: 1. Select Diagnostics on the menu bar and then Processes at the top of the page. Note: The Adobe SVG plug-in is required to view the CPU Load Graph. EDS User Guide 130
-
 1
1 -
2
-
3
-
4
-
5
-
6
-
7
-
8
-
9
-
10
-
11
-
12
-
13
-
14
-
15
-
16
-
17
-
18
-
19
-
20
-
21
-
22
-
23
-
24
-
25
-
26
-
27
-
28
-
29
-
30
-
31
-
32
-
33
-
34
-
35
-
36
-
37
-
38
-
39
-
40
-
41
-
42
-
43
-
44
-
45
-
46
-
47
-
48
-
49
-
50
-
51
-
52
-
53
-
54
-
55
-
56
-
57
-
58
-
59
-
60
-
61
-
62
-
63
-
64
-
65
-
66
-
67
-
68
-
69
-
70
-
71
-
72
-
73
-
74
-
75
-
76
-
77
-
78
-
79
-
80
-
81
-
82
-
83
-
84
-
85
-
86
-
87
-
88
-
89
-
90
-
91
-
92
-
93
-
94
-
95
-
96
-
97
-
98
-
99
-
100
-
101
-
102
-
103
-
104
-
105
-
106
-
107
-
108
-
109
-
110
-
111
-
112
-
113
-
114
-
115
-
116
-
117
-
118
-
119
-
120
-
121
-
122
-
123
-
124
-
 125
125 -
 126
126 -
 127
127 -
 128
128 -
 129
129 -
 130
130 -
 131
131 -
 132
132 -
 133
133 -
 134
134 -
 135
135 -
136
-
137
-
138
-
139
-
140
-
141
-
142
-
143
-
144
-
145
-
146
-
147
-
148
-
149
-
150
-
151
-
152
-
153
-
154
-
155
-
156
-
157
-
158
-
159
-
160
-
161
-
162
-
163
 |
 |

14: Maintenance and Diagnostics Settings
EDS User Guide
130
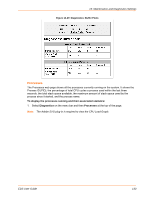
Figure 14-29
Diagnostics: Buffer Pools
Processes
The Processes web page shows all the processes currently running on the system. It shows the
Process ID (PID), the percentage of total CPU cycles a process used within the last three
seconds, the total stack space available, the maximum amount of stack space used by the
process since it started, and the process name.
To display the processes running and their associated statistics:
1.
Select
Diagnostics
on the menu bar and then
Processes
at the top of the page.
Note:
The Adobe SVG plug-in is required to view the CPU Load Graph.