Netgear WGR614v3 WGR614v3 Reference Manual - Page 58
Router Statistics screen, Table 5-1., Show Statistics action buttons, Set Interval - update
 |
View all Netgear WGR614v3 manuals
Add to My Manuals
Save this manual to your list of manuals |
Page 58 highlights
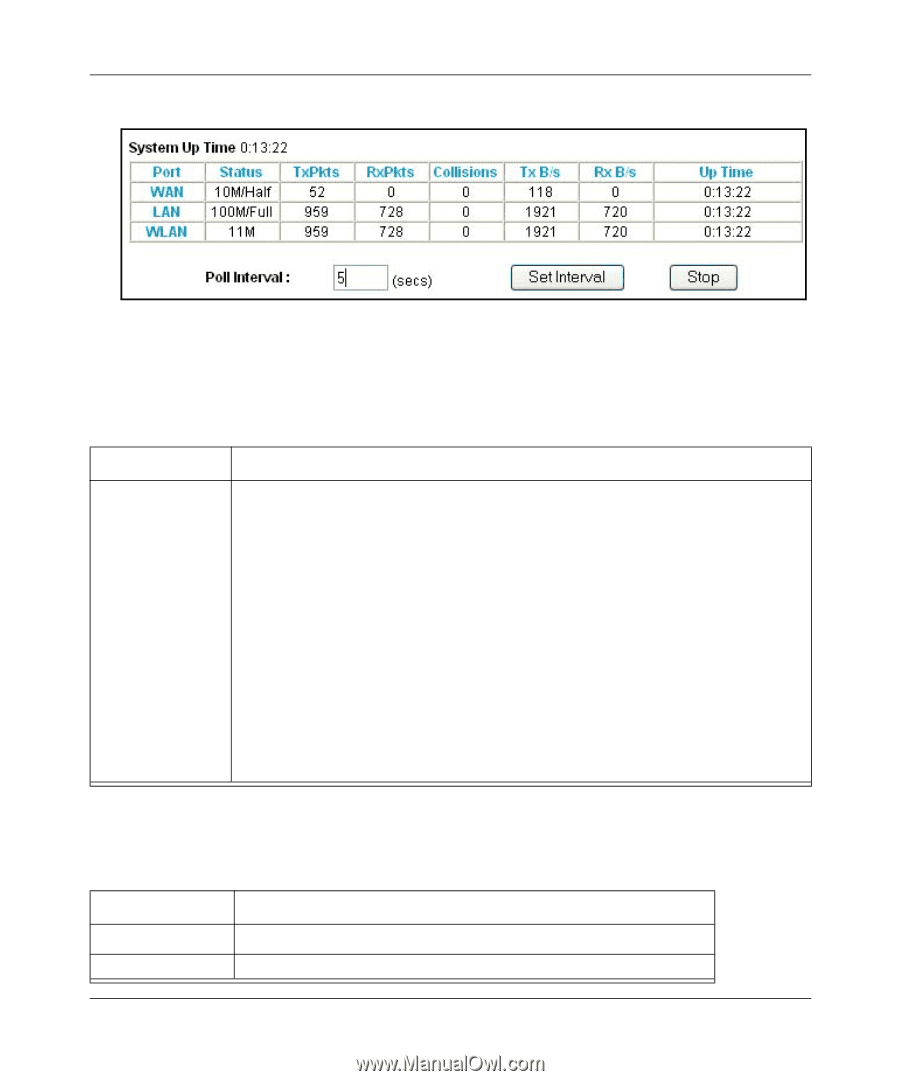
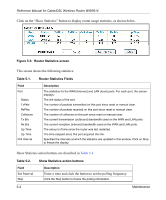
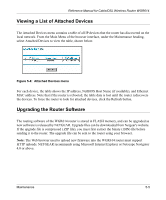
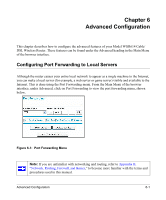
Reference Manual for Cable/DSL Wireless Router WGR614 Click on the "Show Statistics" button to display router usage statistics, as shown below. Figure 5-3: Router Statistics screen This screen shows the following statistics: Table 5-1. Router Statistics Fields Field Port Status TxPkts RxPkts Collisions Tx B/s Rx B/s Up Time Up Time Poll Interval Description The statistics for the WAN (Internet) and LAN (local) ports. For each port, the screen displays: The link status of the port. The number of packets transmitted on this port since reset or manual clear. The number of packets received on this port since reset or manual clear. The number of collisions on this port since reset or manual clear. The current transmission (outbound) bandwidth used on the WAN and LAN ports. The current reception (inbound) bandwidth used on the WAN and LAN ports. The amount of time since the router was last restarted. The time elapsed since this port acquired the link. Specifies the intervals at which the statistics are updated in this window. Click on Stop to freeze the display. Show Statistics action buttons are described in Table 5-2 Table 5-2. Field Set Interval Stop Show Statistics action buttons Description Enter a time and click the button to set the polling frequency. Click the Stop button to freeze the polling information. 5-4 Maintenance
-
 1
1 -
2
-
3
-
4
-
5
-
6
-
7
-
8
-
9
-
10
-
11
-
12
-
13
-
14
-
15
-
16
-
17
-
18
-
19
-
20
-
21
-
22
-
23
-
24
-
25
-
26
-
27
-
28
-
29
-
30
-
31
-
32
-
33
-
34
-
35
-
36
-
37
-
38
-
39
-
40
-
41
-
42
-
43
-
44
-
45
-
46
-
47
-
48
-
49
-
50
-
51
-
52
-
 53
53 -
 54
54 -
 55
55 -
 56
56 -
 57
57 -
 58
58 -
 59
59 -
 60
60 -
 61
61 -
 62
62 -
 63
63 -
64
-
65
-
66
-
67
-
68
-
69
-
70
-
71
-
72
-
73
-
74
-
75
-
76
-
77
-
78
-
79
-
80
-
81
-
82
-
83
-
84
-
85
-
86
-
87
-
88
-
89
-
90
-
91
-
92
-
93
-
94
-
95
-
96
-
97
-
98
-
99
-
100
-
101
-
102
-
103
-
104
-
105
-
106
-
107
-
108
-
109
-
110
-
111
-
112
-
113
-
114
-
115
-
116
-
117
-
118
-
119
-
120
-
121
-
122
-
123
-
124
-
125
-
126
-
127
-
128
-
129
-
130
-
131
-
132
-
133
-
134
-
135
-
136
-
137
-
138
-
139
-
140
-
141
-
142
-
143
-
144
-
145
-
146
 |
 |