Pentax 18506 Operation Manual - Page 50
Taking Pictures, No Icons, LCD Monitor Off, Using Histogram, image, and the graph peak tends
 |
UPC - 027075114531
View all Pentax 18506 manuals
Add to My Manuals
Save this manual to your list of manuals |
Page 50 highlights
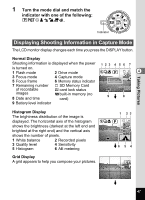
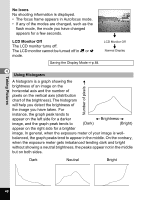
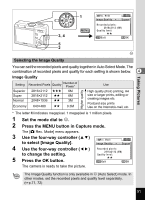
Taking Pictures No Icons No shooting information is displayed. • The focus frame appears in Autofocus mode. • If any of the modes are changed, such as the flash mode, the mode you have changed appears for a few seconds. LCD Monitor Off The LCD monitor turns off. The LCD monitor cannot be turned off in C or + mode. Saving the Display Mode 1p.84 LCD Monitor Off Normal Display 4 Using Histogram A histogram is a graph showing the Number of pixels brightness of an image on the horizontal axis and the number of pixels on the vertical axis (distribution chart of the brightness). The histogram will help you detect the brightness of the image you have taken. For instance, the graph peak tends to appear on the left side for a darker Brightness image, and the graph peak tends to (Dark) (Bright) appear on the right side for a brighter image. In general, when the exposure meter of your image is well- balanced, the graph peaks tend to appear in the middle. On the contrary, when the exposure meter gets imbalanced tending dark and bright without showing a neutral brightness, the peaks appear not in the middle but on both sides. Dark Neutral Bright 48
-
 1
1 -
2
-
3
-
4
-
5
-
6
-
7
-
8
-
9
-
10
-
11
-
12
-
13
-
14
-
15
-
16
-
17
-
18
-
19
-
20
-
21
-
22
-
23
-
24
-
25
-
26
-
27
-
28
-
29
-
30
-
31
-
32
-
33
-
34
-
35
-
36
-
37
-
38
-
39
-
40
-
41
-
42
-
43
-
44
-
 45
45 -
 46
46 -
 47
47 -
 48
48 -
 49
49 -
 50
50 -
 51
51 -
 52
52 -
 53
53 -
 54
54 -
 55
55 -
56
-
57
-
58
-
59
-
60
-
61
-
62
-
63
-
64
-
65
-
66
-
67
-
68
-
69
-
70
-
71
-
72
-
73
-
74
-
75
-
76
-
77
-
78
-
79
-
80
-
81
-
82
-
83
-
84
-
85
-
86
-
87
-
88
-
89
-
90
-
91
-
92
-
93
-
94
-
95
-
96
-
97
-
98
-
99
-
100
-
101
-
102
-
103
-
104
-
105
-
106
-
107
-
108
-
109
-
110
-
111
-
112
-
113
-
114
-
115
-
116
-
117
-
118
-
119
-
120
-
121
-
122
-
123
-
124
-
125
-
126
-
127
-
128
-
129
-
130
-
131
-
132
-
133
-
134
-
135
-
136
-
137
-
138
-
139
-
140
-
141
-
142
-
143
-
144
-
145
-
146
-
147
-
148
-
149
-
150
-
151
-
152
-
153
-
154
-
155
-
156
 |
 |
