Pentax Optio RZ18 White Operation Manual - Page 31
Understanding Brightness, Understanding Contrast
 |
View all Pentax Optio RZ18 White manuals
Add to My Manuals
Save this manual to your list of manuals |
Page 31 highlights
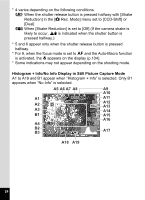
Understanding Brightness If the brightness is correct, the graph peaks in the middle. If the image is too dark, the peak is on the left side, and if it is too bright, the peak is on the right side. Dark image Correct image Bright image When the image is too dark, the part to the left is cut off (dark portions) and when the image is too bright, the part to the right is cut off (bright portions). Understanding Contrast The graph peaks gradually for images in which contrast is balanced. The graph peaks on both sides but sinks in the middle for images with a large difference in contrast and low amounts of mid-level brightness. 29
-
 1
1 -
2
-
3
-
4
-
5
-
6
-
7
-
8
-
9
-
10
-
11
-
12
-
13
-
14
-
15
-
16
-
17
-
18
-
19
-
20
-
21
-
22
-
23
-
24
-
25
-
 26
26 -
 27
27 -
 28
28 -
 29
29 -
 30
30 -
 31
31 -
 32
32 -
 33
33 -
 34
34 -
 35
35 -
 36
36 -
37
-
38
-
39
-
40
-
41
-
42
-
43
-
44
-
45
-
46
-
47
-
48
-
49
-
50
-
51
-
52
-
53
-
54
-
55
-
56
-
57
-
58
-
59
-
60
-
61
-
62
-
63
-
64
-
65
-
66
-
67
-
68
-
69
-
70
-
71
-
72
-
73
-
74
-
75
-
76
-
77
-
78
-
79
-
80
-
81
-
82
-
83
-
84
-
85
-
86
-
87
-
88
-
89
-
90
-
91
-
92
-
93
-
94
-
95
-
96
-
97
-
98
-
99
-
100
-
101
-
102
-
103
-
104
-
105
-
106
-
107
-
108
-
109
-
110
-
111
-
112
-
113
-
114
-
115
-
116
-
117
-
118
-
119
-
120
-
121
-
122
-
123
-
124
-
125
-
126
-
127
-
128
-
129
-
130
-
131
-
132
-
133
-
134
-
135
-
136
-
137
-
138
-
139
-
140
-
141
-
142
-
143
-
144
-
145
-
146
-
147
-
148
-
149
-
150
-
151
-
152
-
153
-
154
-
155
-
156
-
157
-
158
-
159
-
160
-
161
-
162
-
163
-
164
-
165
-
166
-
167
-
168
-
169
-
170
-
171
-
172
-
173
-
174
-
175
-
176
-
177
-
178
-
179
-
180
-
181
-
182
-
183
-
184
-
185
-
186
-
187
-
188
-
189
-
190
-
191
-
192
-
193
-
194
-
195
-
196
-
197
-
198
-
199
-
200
-
201
-
202
-
203
-
204
-
205
-
206
-
207
-
208
-
209
-
210
-
211
-
212
-
213
-
214
-
215
-
216
-
217
-
218
-
219
-
220
-
221
-
222
-
223
-
224
-
225
-
226
-
227
-
228
-
229
-
230
-
231
-
232
-
233
-
234
-
235
-
236
-
237
-
238
-
239
-
240
-
241
-
242
-
243
-
244
-
245
-
246
-
247
-
248
-
249
-
250
-
251
-
252
-
253
-
254
-
255
-
256
-
257
-
258
-
259
-
260
 |
 |

29
Understanding Brightness
If the brightness is correct, the graph peaks in the middle. If the image is
too dark, the peak is on the left side, and if it is too bright, the peak is on
the right side.
When the image is too dark, the part to the left is cut off (dark portions)
and when the image is too bright, the part to the right is cut off (bright
portions).
Understanding Contrast
The graph peaks gradually for images in which contrast is balanced. The
graph peaks on both sides but sinks in the middle for images with a large
difference in contrast and low amounts of mid-level brightness.
Dark image
Correct image
Bright image