Texas Instruments BA II PLUS PRO User Manual - Page 70
Entering Statistical Data, Correlation Coefficient - probability
 |
UPC - 033317192045
View all Texas Instruments BA II PLUS PRO manuals
Add to My Manuals
Save this manual to your list of manuals |
Page 70 highlights
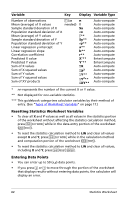
• Ln uses ln(X) and Y. • EXP uses X and ln(Y). • PWR uses ln(X) and ln(Y). The calculator determines the values for a and b that create the line or curve that best fits the data. Correlation Coefficient The calculator also determines r, the correlation coefficient, which measures the goodness of fit of the equation with the data. Generally: • The closer r is to 1 or -1, the better the fit. • The closer r is to zero, the worse the fit. Entering Statistical Data Because the Statistics worksheet lets you enter and display up to 50 data points, and then stores the values until you clear the worksheet or change the values, you probably will not have to perform every step for each Statistics calculation. 1. To select the data-entry portion of the Statistics worksheet, press & j. X01 is displayed along with any previous value. 2. To clear the worksheet, press & z. 3. Key in a value for X01 and press !. • For one-variable data, X01 is the first data point. • For two-variable data, X01 is the first X value. 4. To display the Y01 variable, press #. 5. Key in a value for Y01 and press !. • For one-variable data, you can enter the number of times the X value occurs (frequency). The default value is 1. • For two-variable data, enter the first Y value. 6. To display the next X variable, press #. 7. Repeat steps 3 through 5 until you enter all of the data points. Note: To easily scroll up or down through a range of variables, press and hold # or ". 66 Statistics Worksheet
-
 1
1 -
2
-
3
-
4
-
5
-
6
-
7
-
8
-
9
-
10
-
11
-
12
-
13
-
14
-
15
-
16
-
17
-
18
-
19
-
20
-
21
-
22
-
23
-
24
-
25
-
26
-
27
-
28
-
29
-
30
-
31
-
32
-
33
-
34
-
35
-
36
-
37
-
38
-
39
-
40
-
41
-
42
-
43
-
44
-
45
-
46
-
47
-
48
-
49
-
50
-
51
-
52
-
53
-
54
-
55
-
56
-
57
-
58
-
59
-
60
-
61
-
62
-
63
-
64
-
 65
65 -
 66
66 -
 67
67 -
 68
68 -
 69
69 -
 70
70 -
 71
71 -
 72
72 -
 73
73 -
 74
74 -
 75
75 -
76
-
77
-
78
-
79
-
80
-
81
-
82
-
83
-
84
-
85
-
86
-
87
-
88
-
89
-
90
-
91
-
92
-
93
-
94
-
95
-
96
-
97
-
98
-
99
-
100
-
101
-
102
-
103
-
104
-
105
-
106
-
107
-
108
-
109
-
110
-
111
-
112
-
113
-
114
 |
 |