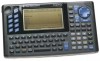
Texas Instruments TI-92 Owners Manual - Page 620
S continued, Set factors, Shade, SLPFLD, Solution Method, Split App, Split Screen, Box Plot
 |
UPC - 033317198153
View all Texas Instruments TI-92 manuals
Add to My Manuals
Save this manual to your list of manuals |
Page 620 highlights
S (continued) seq( ), sequence, 494 sequence graphing, 139 - 151 serial number, 55 service information, 580 set folder, setFold( ), 101, 300, 495 graph, setGraph( ), 300, 305, 495 mode, setMode( ), 300, 305, 496 table, setTable( ), 225, 300, 305, 497 units, setUnits( ), 300, 497 Set factors (zoom), 119, 121 setFold( ), set folder, 101, 300, 495 setGraph( ), set graph, 300, 305, 495 setMode( ), set mode, 300, 305, 496 setTable( ), set table, 225, 300, 305, 497 setUnits( ), set units, 300, 497 Shade (graph math tool), 122, 126 Shade, shade, 308, 498 shift( ), shift, 250, 293, 348, 499 ShowStat, show statistical results, 262, 500 sign( ), sign, 500 simplification delayed, 66 rules, 64 stopping, 65 simult( ), simultaneous equations, 73, 500 sinê( ), arcsine, 501 sin( ), sine, 501 sinhê( ), hyperbolic arcsine, 502 sinh( ), hyperbolic sine, 502 SinReg, sinusoidal regression, 262, 503, 571 SLPFLD, slope field, 180, 185, 197 Smart Graph, 115 software version, 55 Solution Method graph format, 180 solution, deSolve( ), 75, 196, 434 solve( ), solve, 9, 58, 61, 62, 63, 66, 68, 70, 73, 196, 503 solving linear equations, 9, 10, 73 SortA, sort ascending, 506 SortD, sort descending, 506 sorting ascending, SortA, 506 descending, SortD, 506 special characters, 21, 324, 325 spherical vector display, 4Sphere, 506 Split App mode, 41, 553 split screen, 209, 211, 231 - 236, 329, 341 entry line, 235, 236 exiting, 234 pixel coordinates, 234 setting, 233 switch, switch( ), 300, 509 switching, 235 Split Screen mode, 41, 552 square root, ‡( ), 533 standard annuity activity, 404 standard deviation, stdDev( ), 506 statistics, 253 - 273. See also regressions Box Plot, 266 Calculation Type, 259, 261 categories, 270, 271 Category, 259, 260 combinations, nCr( ), 470 factorial, !, 8, 531 Freq, 259, 260 frequency, 270, 271 Histogram plots, 267 mean, mean( ), 467 median, median( ), 467 new plot, NewPlot, 266, 472 one-variable statistics, OneVar, 261, 475 operations, 412 overview, 258 permutations, nPr( ), 474 plots, 264, 265, 266, 267, 268, 269 plots off, PlotsOff, 111, 305, 480 plots on, PlotsOn, 111, 305, 480 random norm, randNorm( ), 488 random number seed, RandSeed, 388, 488 random number, rand( ), 488 Scatter plots, 266 show results, ShowStat, 262, 500 standard deviation, stdDev( ), 506 two-variable results, TwoVar, 261, 516 variables, 260, 263 variance, variance( ), 517 xyline plots, 266 status line, 53, 54, 108 stdDev( ), standard deviation, 506 StoGDB, store graph database, 220, 306, 507 Stop, stop, 282, 507 StoPic, store picture, 306, 507 stopping a calculation, 28 storing graph database, StoGDB, 220, 306, 507 picture, StoPic, 306, 507 symbol, !, 289, 539 string( ), expression to string, 293, 508 strings append, &, 293, 532 character code, ord( ), 293, 476, 555 character string, char( ), 293, 419, 555 dimension, dim( ), 293, 437 expression to string, string( ), 293, 508 format, format( ), 293, 302, 450 indirection, #, 293, 534, 569 inputting, InputSt, 292, 301, 371 left, left( ), 293, 460 mid-string, mid( ), 293, 468 operations, 292, 293, 413 right, right( ), 293, 491 rotate, rotate( ), 293, 491 Index 603
-
 1
1 -
2
-
3
-
4
-
5
-
6
-
7
-
8
-
9
-
10
-
11
-
12
-
13
-
14
-
15
-
16
-
17
-
18
-
19
-
20
-
21
-
22
-
23
-
24
-
25
-
26
-
27
-
28
-
29
-
30
-
31
-
32
-
33
-
34
-
35
-
36
-
37
-
38
-
39
-
40
-
41
-
42
-
43
-
44
-
45
-
46
-
47
-
48
-
49
-
50
-
51
-
52
-
53
-
54
-
55
-
56
-
57
-
58
-
59
-
60
-
61
-
62
-
63
-
64
-
65
-
66
-
67
-
68
-
69
-
70
-
71
-
72
-
73
-
74
-
75
-
76
-
77
-
78
-
79
-
80
-
81
-
82
-
83
-
84
-
85
-
86
-
87
-
88
-
89
-
90
-
91
-
92
-
93
-
94
-
95
-
96
-
97
-
98
-
99
-
100
-
101
-
102
-
103
-
104
-
105
-
106
-
107
-
108
-
109
-
110
-
111
-
112
-
113
-
114
-
115
-
116
-
117
-
118
-
119
-
120
-
121
-
122
-
123
-
124
-
125
-
126
-
127
-
128
-
129
-
130
-
131
-
132
-
133
-
134
-
135
-
136
-
137
-
138
-
139
-
140
-
141
-
142
-
143
-
144
-
145
-
146
-
147
-
148
-
149
-
150
-
151
-
152
-
153
-
154
-
155
-
156
-
157
-
158
-
159
-
160
-
161
-
162
-
163
-
164
-
165
-
166
-
167
-
168
-
169
-
170
-
171
-
172
-
173
-
174
-
175
-
176
-
177
-
178
-
179
-
180
-
181
-
182
-
183
-
184
-
185
-
186
-
187
-
188
-
189
-
190
-
191
-
192
-
193
-
194
-
195
-
196
-
197
-
198
-
199
-
200
-
201
-
202
-
203
-
204
-
205
-
206
-
207
-
208
-
209
-
210
-
211
-
212
-
213
-
214
-
215
-
216
-
217
-
218
-
219
-
220
-
221
-
222
-
223
-
224
-
225
-
226
-
227
-
228
-
229
-
230
-
231
-
232
-
233
-
234
-
235
-
236
-
237
-
238
-
239
-
240
-
241
-
242
-
243
-
244
-
245
-
246
-
247
-
248
-
249
-
250
-
251
-
252
-
253
-
254
-
255
-
256
-
257
-
258
-
259
-
260
-
261
-
262
-
263
-
264
-
265
-
266
-
267
-
268
-
269
-
270
-
271
-
272
-
273
-
274
-
275
-
276
-
277
-
278
-
279
-
280
-
281
-
282
-
283
-
284
-
285
-
286
-
287
-
288
-
289
-
290
-
291
-
292
-
293
-
294
-
295
-
296
-
297
-
298
-
299
-
300
-
301
-
302
-
303
-
304
-
305
-
306
-
307
-
308
-
309
-
310
-
311
-
312
-
313
-
314
-
315
-
316
-
317
-
318
-
319
-
320
-
321
-
322
-
323
-
324
-
325
-
326
-
327
-
328
-
329
-
330
-
331
-
332
-
333
-
334
-
335
-
336
-
337
-
338
-
339
-
340
-
341
-
342
-
343
-
344
-
345
-
346
-
347
-
348
-
349
-
350
-
351
-
352
-
353
-
354
-
355
-
356
-
357
-
358
-
359
-
360
-
361
-
362
-
363
-
364
-
365
-
366
-
367
-
368
-
369
-
370
-
371
-
372
-
373
-
374
-
375
-
376
-
377
-
378
-
379
-
380
-
381
-
382
-
383
-
384
-
385
-
386
-
387
-
388
-
389
-
390
-
391
-
392
-
393
-
394
-
395
-
396
-
397
-
398
-
399
-
400
-
401
-
402
-
403
-
404
-
405
-
406
-
407
-
408
-
409
-
410
-
411
-
412
-
413
-
414
-
415
-
416
-
417
-
418
-
419
-
420
-
421
-
422
-
423
-
424
-
425
-
426
-
427
-
428
-
429
-
430
-
431
-
432
-
433
-
434
-
435
-
436
-
437
-
438
-
439
-
440
-
441
-
442
-
443
-
444
-
445
-
446
-
447
-
448
-
449
-
450
-
451
-
452
-
453
-
454
-
455
-
456
-
457
-
458
-
459
-
460
-
461
-
462
-
463
-
464
-
465
-
466
-
467
-
468
-
469
-
470
-
471
-
472
-
473
-
474
-
475
-
476
-
477
-
478
-
479
-
480
-
481
-
482
-
483
-
484
-
485
-
486
-
487
-
488
-
489
-
490
-
491
-
492
-
493
-
494
-
495
-
496
-
497
-
498
-
499
-
500
-
501
-
502
-
503
-
504
-
505
-
506
-
507
-
508
-
509
-
510
-
511
-
512
-
513
-
514
-
515
-
516
-
517
-
518
-
519
-
520
-
521
-
522
-
523
-
524
-
525
-
526
-
527
-
528
-
529
-
530
-
531
-
532
-
533
-
534
-
535
-
536
-
537
-
538
-
539
-
540
-
541
-
542
-
543
-
544
-
545
-
546
-
547
-
548
-
549
-
550
-
551
-
552
-
553
-
554
-
555
-
556
-
557
-
558
-
559
-
560
-
561
-
562
-
563
-
564
-
565
-
566
-
567
-
568
-
569
-
570
-
571
-
572
-
573
-
574
-
575
-
576
-
577
-
578
-
579
-
580
-
581
-
582
-
583
-
584
-
585
-
586
-
587
-
588
-
589
-
590
-
591
-
592
-
593
-
594
-
595
-
596
-
597
-
598
-
599
-
600
-
601
-
602
-
603
-
604
-
605
-
606
-
607
-
608
-
609
-
610
-
611
-
612
-
613
-
614
-
 615
615 -
 616
616 -
 617
617 -
 618
618 -
 619
619 -
 620
620 -
 621
621 -
 622
622 -
 623
623
 |
 |