ZyXEL NWA50AX User Guide - Page 179
Remote Capture
 |
View all ZyXEL NWA50AX manuals
Add to My Manuals
Save this manual to your list of manuals |
Page 179 highlights
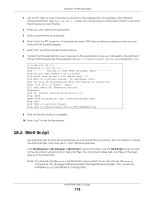
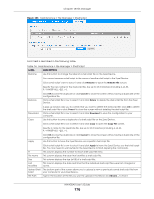
Chapter 19 Diagnostics Figure 108 Maintenance > Diagnostics: Debug Information Collector 19.3 Remote Capture Use this screen to capture network traffic going through the Zyxel Device connected to the Zyxel gateway or ZyWALL, and output the captured packets to a packet analyzer (also known as network or protocol analyzer) such as Wireshark. Click Maintenance> Diagnostics> Remote Capture to open the Remote Capture screen. Figure 109 Maintenance > Diagnostics> Remote Capture The following table describes the labels in this screen. Table 75 Maintenance > Diagnostics> Remote Capture LABEL DESCRIPTION Server Port Enter the number of the server port you want the packet analyzer to connect to in order to capture traffic going through the Zyxel Device. The default port number is 2002. Start Click this button to allow the packet analyzer to start capturing traffic going through the Zyxel Device. Stop Click this button to stop the packet analyzer from capturing traffic going through the Zyxel Device. NWA50AX User's Guide 179
-
 1
1 -
2
-
3
-
4
-
5
-
6
-
7
-
8
-
9
-
10
-
11
-
12
-
13
-
14
-
15
-
16
-
17
-
18
-
19
-
20
-
21
-
22
-
23
-
24
-
25
-
26
-
27
-
28
-
29
-
30
-
31
-
32
-
33
-
34
-
35
-
36
-
37
-
38
-
39
-
40
-
41
-
42
-
43
-
44
-
45
-
46
-
47
-
48
-
49
-
50
-
51
-
52
-
53
-
54
-
55
-
56
-
57
-
58
-
59
-
60
-
61
-
62
-
63
-
64
-
65
-
66
-
67
-
68
-
69
-
70
-
71
-
72
-
73
-
74
-
75
-
76
-
77
-
78
-
79
-
80
-
81
-
82
-
83
-
84
-
85
-
86
-
87
-
88
-
89
-
90
-
91
-
92
-
93
-
94
-
95
-
96
-
97
-
98
-
99
-
100
-
101
-
102
-
103
-
104
-
105
-
106
-
107
-
108
-
109
-
110
-
111
-
112
-
113
-
114
-
115
-
116
-
117
-
118
-
119
-
120
-
121
-
122
-
123
-
124
-
125
-
126
-
127
-
128
-
129
-
130
-
131
-
132
-
133
-
134
-
135
-
136
-
137
-
138
-
139
-
140
-
141
-
142
-
143
-
144
-
145
-
146
-
147
-
148
-
149
-
150
-
151
-
152
-
153
-
154
-
155
-
156
-
157
-
158
-
159
-
160
-
161
-
162
-
163
-
164
-
165
-
166
-
167
-
168
-
169
-
170
-
171
-
172
-
173
-
 174
174 -
 175
175 -
 176
176 -
 177
177 -
 178
178 -
 179
179 -
 180
180 -
 181
181 -
 182
182 -
 183
183 -
 184
184 -
185
-
186
-
187
-
188
-
189
-
190
-
191
-
192
-
193
-
194
-
195
-
196
-
197
-
198
-
199
-
200
-
201
-
202
-
203
-
204
-
205
-
206
-
207
-
208
-
209
-
210
-
211
-
212
-
213
-
214
-
215
-
216
-
217
-
218
-
219
-
220
-
221
-
222
-
223
-
224
-
225
-
226
-
227
-
228
-
229
-
230
-
231
-
232
-
233
-
234
-
235
-
236
-
237
-
238
-
239
-
240
-
241
-
242
-
243
-
244
-
245
-
246
-
247
-
248
-
249
-
250
-
251
-
252
-
253
-
254
-
255
-
256
 |
 |
